

Guest economic analysis and muni commentary: John Hallacy
—————–
From John Hallacy:
We continue to receive weighty news in the negative direction. Not much relief is in sight on the horizon. On the inflation front, we continue to run hot at the 8.3% mark. Breaking down the components also does not glean much positive news. It is hard to say exactly when the pace of inflation will break its current path. The Fed is determined to bring inflation down appreciably. The question is how long the process will take and how many 50bps moves will be necessary. The fine point is not triggering a recession in applying the remedy. Some economists are simply defaulting to the position that it will take a recession to alter the trend. I hope this is not the case. The Chair has stated his admiration for Volcker but at the same time does not want to pursue the same exact path that ended stagflation so many years ago.
On the brighter side for some observers, the federal government collected record receipts in April. April always tends to be the high-water mark for the year given it is tax time. Ensuing months are not likely to be quite so robust. But there has been enough improvement that the forecast for the deficit for this federal fiscal year will be more modest than the recent past. Perhaps, Treasury issuance may slow appreciably and will not crowd out other issuance. One aspect that has a higher degree of certainty is that the newer vintage debt will be carrying higher interest rates.
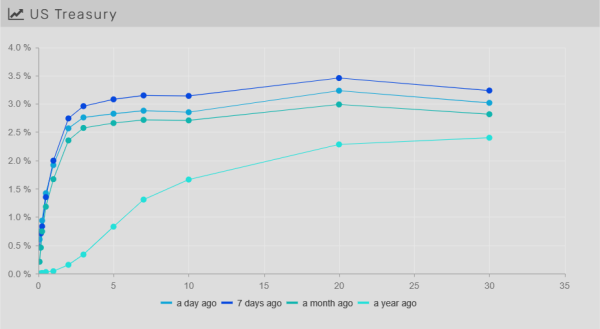
The spread from 3 months to the 10yr Treasury is still not flashing the recession indication yet. Some are looking to the 2yr to 10yr spread for guidance. Academics argue that the critical relationship to monitor remains the 3 months to 10yr spread.
On the political front there is much to parse while the mid-term elections are rapidly approaching. The economy still ranks at the highest level of issues on the voters’ minds. Employment and unemployment are at favorable levels. We are told that many jobs remain open and are quite hard to fill. Employers must compromise on what they are seeking from candidates if those slots are to be filled. Immigration is not helping now.
Although the economy is in good condition, the tone is turning more negative. People see that there 401ks are under attack in this environment. The wealth effect is kicking into higher gear. When portfolio losses are of such a magnitude, it is more challenging to stay positive. Higher rates are causing losses in existing portfolios at the same time some higher rates may be obtained from new investments.
Successful political candidates may have to shed some light on how we extricate ourselves from the current morass. But there are no easy solutions.
We do think that there will be an increasing shift by investors to taking on more fixed income over time. Heading to mid-year, there is bound to be more supply unless rates have a cooling effect on the activity. There have been many articles of late that the 60/40 portfolio is dead. We are keeping an open mind.
Data and hikes vs. risk sentiment: no one wins but the VIX
Treasury bond trading ranges kept fixed income investors on their toes this week. After early increases in yields across the curve, marking 3 ½ year highs in rates, they quickly turned lower on growth fears and souring risk sentiment stemming from a massive equity selloff. The 10yr traded in +/- 39bps range, topping out at 3.20% and ratcheting lower to 2.81% at the lows, and finally settled lower WoW at 2.92% (-15bps) at the time of writing. Ultimately the curve flattened with the long end moving lower than the front end, with 2-10s curve about -10bps lower WoW (+27bps), as flight to quality outweighed future expectations of rate hikes.
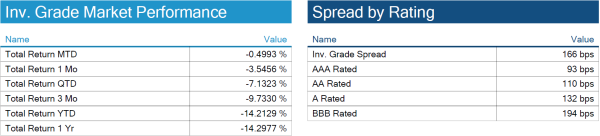
IG spreads widen ~5bps on week
Spreads widen as inflation and increased chances of recession move markets lower. Earnings were not positive on the week, but inflation will continue to have a large negative affect on the economy. Total return for IG investors continues to move negative but still outperforming equities by 200 bps.
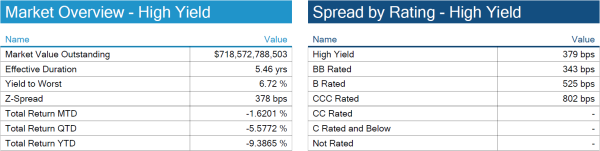
High yield spreads widen ~45bps
High yield corporate bonds continue to sell-off while volatility remains steady. The default rate has started to increase MoM while credit agencies will look to the Russia-Ukraine conflict and long term affects of inflation.

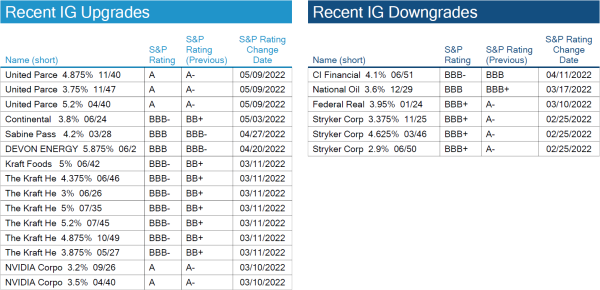
UPS sees small upgrade in long bonds
UPS had some of its long bonds upgraded by S&P from A- to A. A subsidiary of Talon Energy filed for bankruptcy after months of rising power and gas prices disrupted the companies hedges.
John Hallacy: Municipal trends
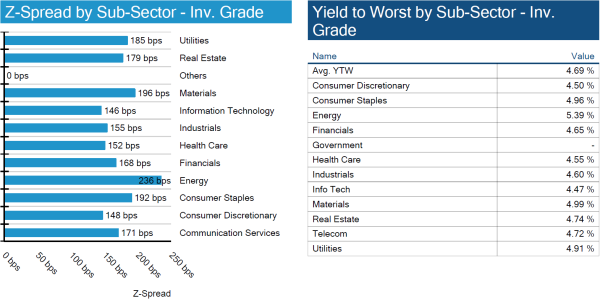
At times such as this, we turn to sector analysis to provide some guidance about where to focus investments. One of the sectors that continues to flourish is the ESG space. As the great philosopher King Kermit once sang: It is not easy being green.
There continues to be an important level of discourse about how to characterize and standardize what is being issued in the ESG-focused marketplace. Should outside certification be required in all instances? Will self-certification withstand the test of time? The regulators have been gathering information, and there may be some more formal statements in the future. In the meantime, investors are relying on their own good judgment to make the call on these matters.
What is clear in the ESG space is that the buy-side has particular items on their shopping lists. Issuers are becoming more informed of these preferences and are doing their best to tap into the strength of that discrete demand. The process to a more refined universe is messy in the way that democracy is messy.
The near-term outlook for municipal supply is for increases before the higher redemption times in June and July. This increase in supply is coming at a time when the outflows from the mutual funds are ongoing. It would be a suitable time to consider new issues at the higher rate levels.
Secondary activity has increased and is more likely to be driven by the institutional segment of the market. Volatility in the market always leads to elevated trading levels.
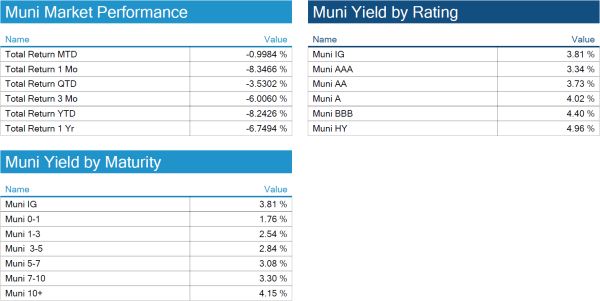
The AAA curve continues to be flat. As of this writing, the 1yr is at 1.99% and by year twelve the level increases to 3%. The curve only increases slowly to 3.27% in thirty years. Investing out to the intermediate range makes sense. Extending beyond poses some valuation risk in the near term as rates rise. One cautionary note is that the total return YTD is -8.426%. (For other measures see table.)
As for sectors, we continue to favor the more “plain vanilla” sectors in the market. There will be a time when high yield will be better compensated than at present.
More about John Hallacy

John is an accomplished municipal and fixed income analyst, respected and recognized by the industry with over 35 years of experience at major financial firms including S&P’s Global Ratings, FGIC, Bond Investors Guaranty, Merrill Lynch, MBIA, Bank of America, Assured Guaranty, and most recently The Bond Buyer. A leading expert in state and local fiscal affairs. John’s experience includes ratings, insurance, public finance and sell side research.
Want more from John Hallacy? Check out his recent guest post on larger muni market trends here.
*Disclosure on all charts: Figures shown above are the weighted aggregate of bonds that currently have an IDC price and based on transactions over the past 2 weeks. This may create anomalies in the data but aligns with our effort to reflect actual market conditions. Data pulled as of end of day Thursday, May 12, 2022.
View full IG, HY, and muni market reports pulled from IMTC:
Want to get this in your email every Sunday? Sign up to receive The Fixed Income Brief weekly.
.