The Fixed Income Brief: The Upside Down
Rate moves over the holiday-shortened week showed that there are still a broad number of outlooks around the likelihood of a recession and the impact the Fed hikes will have on the economy. Every data point is being heavily interpreted to reflect that bad news is good news for investors when gauging whether the FOMC will take their foot off the gas in their pursuit to fight inflation as the expense of growth.

July 10, 2022
Guest economic analysis and muni commentary: David Loesch
Fixed Income Trivia Time:
Where were the 3-month Libor and 10yr U.S. Treasury rates in March 1986*?
*In honor of the release of the second part Stranger Things Season 4 on Netflix, when the show takes place in a fictitious town in Indiana.
We are in the midst of a regularly occurring phenomenon in a rate hike cycle where bad economic data is good for markets and vice versa as it directly correlates to the Fed’s aggressiveness in raising rates going forward. The risk of a recession is building with talk of another +75bps hike on the horizon, but now investors are seeing rate hikes turn into expected rate cuts in mid-2023 as they grapple with weighing predictions of how the rate hike cycle unfolds.
We are again fortunate enough to have partnered with DRL Group’s David Loesch to provide his most recent insights into the fixed income market:
- Signs of a rapidly deteriorating U.S. outlook have spurred bond traders to pencil in a complete policy turnaround by the FED in the coming year, and some are starting to predict rate cuts in the middle of 2023. Bond traders and large Broker/Dealers have rapidly unwound expectations of continuous rate hikes through 2023 and now foresee a peak of around 3.30% in the 1st Q of 2023; by contrast, it was thought by many we would see rates get to 3.75-4% by 2023. Markets are saying that a recession is coming, inflation will slow down, commodities will fall, and the FED will cut rates in 2023 – this is the thought of many in our business right now. Many in our industry believe the FED will cut rates 50bps next year — this might be an over-aggressive claim; however, should we move into the recession, which many are predicting, this is possible.
- July is an active Municipal redemption month. There are about $47B of principal and interest payments from Friday seeking a new home. With low issuance, these payments and another $8.7B mid-month redemptions should help buoy demand in Muni bonds during the month as investors seek to reinvest these funds. This renewed demand supported by what seems to be a more stable Treasury market could convince investors to buy again, particularly when you look at yields at multi-year highs. These factors should help Munis in July after a tough June with the unexpected 75bps hike.
- High yield issuance across fixed-income markets is set to plunge to an estimated $20B. The market selloff this year has roiled the High-Yield markets. Refinancing costs for risker Muni borrowers are on the upswing. Barclays indicated they see lower volume, partly because many borrowers who wanted to refund old debt to cut costs already took advantage of historically low-interest rates last year. As previously mentioned, trading High-Yield debt is risky; as rates increase, refinancing could become problematic.
- At the beginning of June, investors focused on how far the FED would tame inflation and pulled about $1.3B from funds. This action, in my opinion, overshadowed demand. That trend is slowing down significantly, and some think it will reverse as we move into the Fall. Investors will now focus on the next FED meeting and the upcoming CPI numbers looking for clues to the subsequent Fed reaction. We are seeing cuts in yields by the pricing services by about three basis points a day, consistent for the last ~ two weeks. I suspect to will continue to see buying in the market as we move through this week and into these first 2.5 weeks of July.
- The DRL Group has published several articles over the last few weeks in our Municipal commentary about “who” has called this a buying opportunity. Respected money managers like BlackRock and Nuveen are very positive about Muni debt. Many of these analysts said Munis have suffered from an overaction by investors, who have pulled a record $87B from Muni funds spooked by inflation and aggressive action by the FED. They also think we are setting ourselves up for a robust 4th Qtr and perhaps 3rd Qtr. However, all agree that 2023 will be a strong year for this asset class, considering the sharp selloff.
- Investors have bolted from Munis even though state coffers are filled with FED stimulus cash and record tax collections. State tax revenue is 25% above its pre-pandemic peak, and states’ rainy-day funds are at record highs. We are not in a credit issue such as in 2008-2009, Munis from a fundamental standpoint, are in great shape, which should lead to a rebound as we move into the last half of the year. Credits on high-grade paper remain attractive, and pricing will stabilize as we move through the balance of 2022.
- The housing slowdown is helping solve the inflation issue and tight inventory. With fewer buyers competing, the number of U.S. active listings jumped 18.7% in June; this is the most significant increase in data going back to 2017. While many anticipate more inventory, the typical buyer has yet to see meaningful relief in pricing. I suspect we will continue to see a decline in pricing as we move through this year.
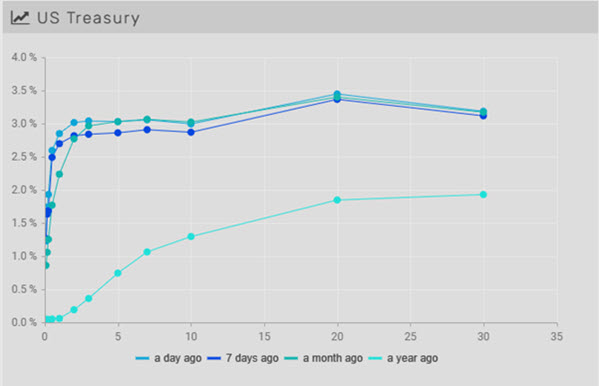
Flatliners, yield curve rises and flattens WoW on better-than-expected jobs data
Yields moved higher this week after having trended down recently. June’s NFP came in better-than-expected and PMI and ISM surveys were also slightly higher showing continued momentum in the economy. Rates across the curve traded higher with the front end performing the worst, with 2yr rising the most (+28bps) and 30yr rising the least (+16bps). This sent the 2s-10s curve into inversion (-2bps), flatter by -8bps and 5s-30s curve (+14bps) flatter by -9bps.
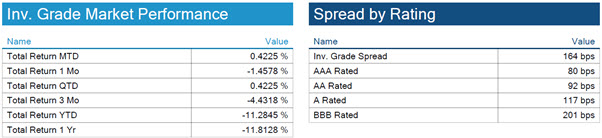
IG spreads widen on week as longer bonds tighten
Spreads widened +~10bps WoW as the market now turns to CPI and earnings season after the jobs and Fed minutes were released this week. Longer-dated industrial paper trader tighter this week, but still 15bps wider than average.
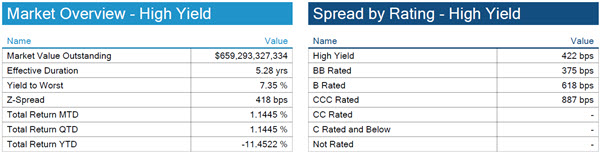
Spreads continue to march higher
HY spreads widen on the week as defaults in the sector increase. The default rate, which was on a steady decline until April of this year, is back to moving higher at 2.2%.
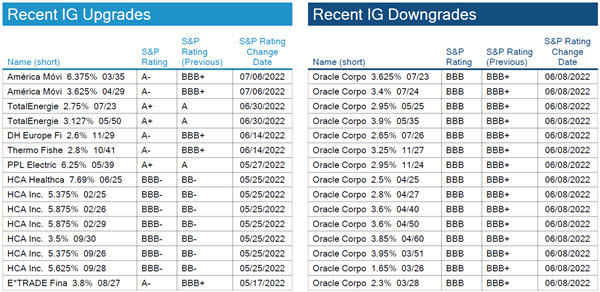
No large movements on the week
S&P upgraded America Movil to single A- on a portion of its U.S. dollar-denominated bonds.
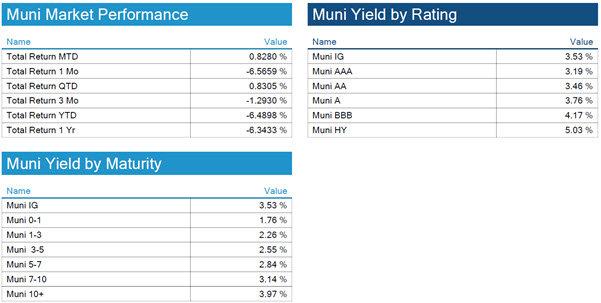
Technicals in muni market set to differentiate the sector in July
More about David Loesch, Owner of DRL Group

David has specialized in fixed income trading since 1994, covering all areas of the bond markets. David deals with everything from defaulted issues to AAA bonds to tax-exempt and taxable bonds. David is constantly collaborating with other dealers in the marketplace bidding on issues and making markets in certain securities. David not only deals with the large institutional accounts on fixed income transactions, but also has a large retail client base that gives a good insight on what the markets are looking for and how the retail world looks at current events in addition to how it affects them on a personal level.
Explore the DRL Group, specialists in bonds, primarily tax-free bonds.
*Disclosure on all charts: Figures shown above are the weighted aggregate of bonds that currently have an IDC price and based on transactions over the past 2 weeks. This may create anomalies in the data but aligns with our effort to reflect actual market conditions. Data pulled as of end of day Thursday, July 7, 2022.
Fixed Income Trivia Time:
3-month Libor = 7.50%
10yr = 7.96%
Want to get this in your email every Sunday? Sign up to receive The Fixed Income Brief weekly.
This paper is intended for information and discussion purposes only. The information contained in this publication is derived from data obtained from sources believed by IMTC to be reliable and is given in good faith, but no guarantees are made by IMTC with regard to the accuracy, completeness, or suitability of the information presented. Nothing within this paper should be relied upon as investment advice, and nothing within shall confer rights or remedies upon, you or any of your employees, creditors, holders of securities or other equity holders or any other person. Any opinions expressed reflect the current judgment of the authors of this paper and do not necessarily represent the opinion of IMTC. IMTC expressly disclaims all representations and warranties, express, implied, statutory or otherwise, whatsoever, including, but not limited to: (i) warranties of merchantability, fitness for a particular purpose, suitability, usage, title, or noninfringement; (ii) that the contents of this white paper are free from error; and (iii) that such contents will not infringe third-party rights. The information contained within this paper is the intellectual property of IMTC and any further dissemination of this paper should attribute rights to IMTC and include this disclaimer.
.
.
Related articles

January 6, 2025