The Fixed Income Brief: Investors Not Spooked by Inflation

Fixed Income Trivia Time:
Recent headlines are comparing 2021 to stagflation in the 1970s, which has resurrected Milton Friedman in conversation. True or False – His Consumption Function theory was that savings decisions are more greatly impacted by permanent changes to income.
From Australia to North America and major economies in between, central banks around the globe are starting to take steps towards unwinding the extreme monetary stimulus in place due to the global pandemic. Stubborn inflation figures have undoubtedly pressured central bankers to move faster than they originally anticipated, and the impact has been a repricing of rate hikes triggering the flattening of yield curves around the globe.
Data this week was highlighted by Friday’s U.S. Core PCE numbers, +0.2% MoM and +3.6% YoY, slightly lower than expectations of +3.7% YoY and in-line MoM. Core PCE remains the key inflation gauge for the Fed and given the figures, there should be no change to the expectation that the Fed will announce the start of tapering at next week’s FOMC meeting.
Next week’s economic focus will be on the two-day FOMC meeting and press conference on Wednesday and the October non-farm payrolls on Friday. The BoE will also meet next week which will give further global insights to the direction of rates and growth expectations. German Manufacturing PMI data out Tuesday and U.S. ISM Non-Manufacturing data out Wednesday will round out the week; in addition, there will be a watchful eye on U.S. initial jobless claims, which continue to trend towards pre-pandemic averages of low 200k.
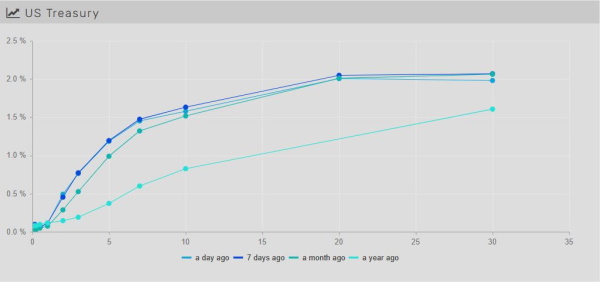
Global Treasury curves flatten as market braces for impacts of stimulus unwinds
As mentioned above, yield curves have flattened across the globe this week, and in the U.S., this has led to 2-10s and 5-30s curves to flatten roughly -15bps each. The front end continues to rise in the face of rate increases moving forward and the long end being capped by ultimate growth concerns on the back of future rate hikes. The U.S. 30yr was lower by ~ -14bps, closing below 2% for the first time since the end of September and the U.S. 2yr rose +6bps, breaking above 0.50% for the first time since March 2020.
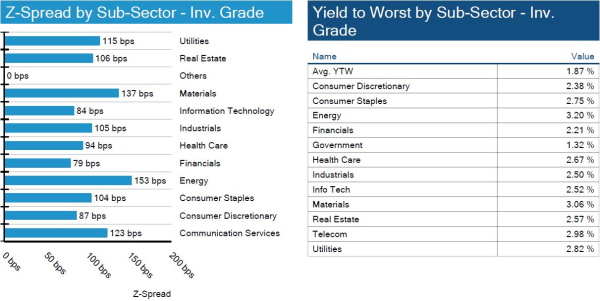
IG credit spreads end week 1bp tighter
The big news this week was interest rates, while spreads modestly tighten. Bonds are still ~20bps tighter from the 12-month wides. Earnings are still positive and should drive away potential credit risk till year-end.
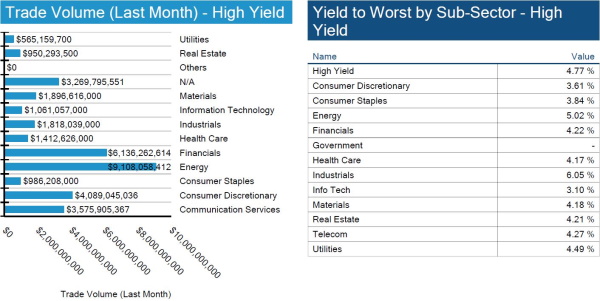
High yield bonds keep default risk low
High yield bond default rates are below ~2.5%, which is a significant change from the start of the COVID-19 pandemic where defaults were above 12%. The impressive reduction of default rates comes with the increase in issuance YoY.
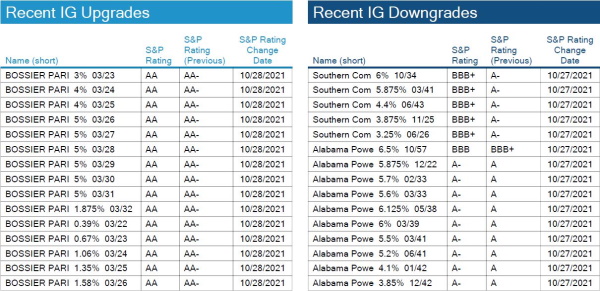
S&P lowers ratings on tranches of utility debt
Southern Company Gas and Alabama Power see specific tranches of their debt downgraded one notch by S&P.
Munis curve flattens, sending returns higher
The municipal bond curve flattened in sympathy with the U.S. Treasury curve, but demand is keeping the front end more anchored at this point. The move almost brings total returns MTD back to even despite questions around anticipated tax increases that have yet to materialize given the ongoing negotiations around the White House’s economic stimulus package. We could see investors pause the unrelenting demand for muni bonds in the face of the Fed next week and clarity around the passage of the Democrats plan.
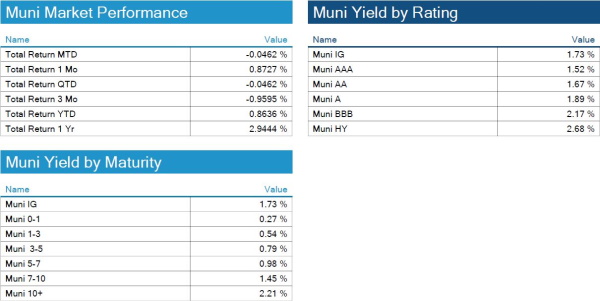
*Disclosure on all charts: Figures shown above are the weighted aggregate of bonds that currently have an IDC price and based off transactions over the past 2 weeks. This may create anomalies in the data but aligns with our effort to reflect actual market conditions. Data pulled as of end of day Thursday, October 28, 2021.
View full IG, HY, and muni market reports pulled from IMTC:
Fixed Income Trivia Time:
True
Want to get this in your email every Sunday? Sign up to receive The Fixed Income Brief weekly.
.


