The Fixed Income Brief: Rates Lower as Hope for an Economic Recovery Dims
U.S. gross domestic product plunged by a record 32.9% in the second quarter and even though the number was not as bad as originally feared (exp. -34.7%), economic activity remains limited by the continued spread of the virus. In addition, the lack of agreement on a second round of stimulus puts the recovery at risk which has sent U.S. interest rates to new all-time lows.

August 2, 2020
The U.S. economy continues to stall, putting pressure on lawmakers to reach an agreement on additional stimulus as aid programs begin to expire. Applications for unemployment insurance increased for the first time since March, remaining above 1 million per week, and a weekly measure of retail sales deteriorated. All this as investors find themselves less than 100 days from an election, which will create two very distinct paths of how the U.S. economy moves forward from here.
The one harbor that bond investors have relied on in the midst of this storm is the Federal Reserve. Chairman Powell and the FOMC came through once again this week with unwavering support of markets. They extended COVID related stimulus measures through the end of 2020 and signaled no hesitancy to act more aggressively and over a longer period, if needed.
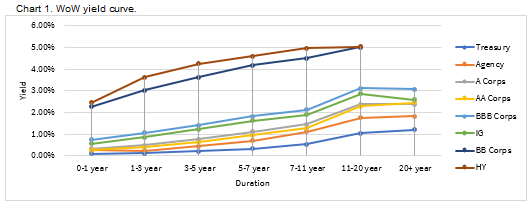
Treasuries continue to test new lows
The yield on the 10-year Treasury note hit a low of 0.520%, its lowest level since March 9. The yield on the 30-year Treasury bond fell slightly to 1.176%, its lowest level since April 29. The front end of the curve continued to tighten with the curve steepening for agencies and corporates.

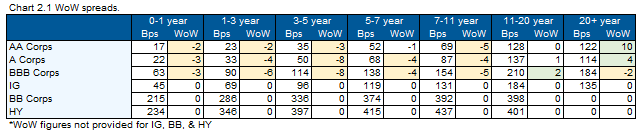
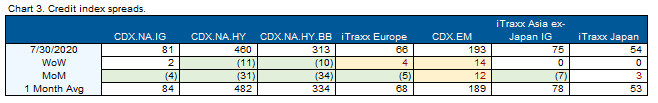
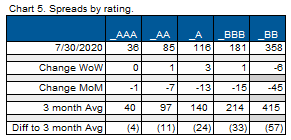
Small divergence in the IG CDX bond basis
CDX IG was flat to slightly wider on the week, while HY and BB continue to tighten (~30 tighter on the month). The steepest part of the credit curve remains the 11-20 year duration. The belly of the curve and sub-single A rated bonds saw the most significant tightening in credit spreads on the week.

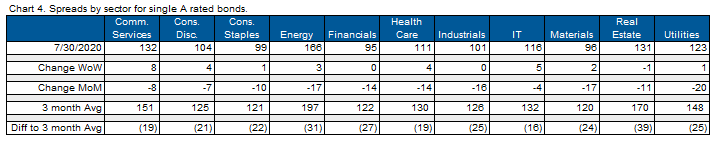
IT rallied going into the weekend, led by better than expected quarterly earnings by Facebook, Amazon, Alphabet and Apple. Month-over-month (MoM), we still see IT lagging other sectors which have performed well of late, including, energy, financials, and healthcare.
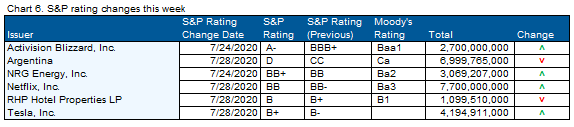
Ratings agencies still expect credit deterioration despite net upgrades to debt this week
Moody’s and S&P both expect deteriorating financials and an increase in downgrades and default probabilities. However, this past week brought a host of upgrades to name brand companies like Tesla and Netflix.
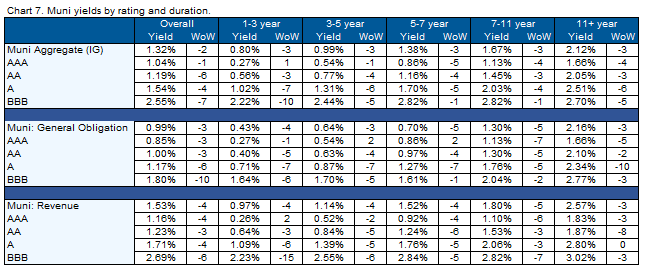
Munis remain in demand despite budget challenges and mixed messages from Congress
Muni yields were lower across the board as individuals, banks, and now insurance companies continue to increase their allocation to the sector. On the year, muni’s moved back to net inflows after a dramatic shift out of the space in March and April. Many investors have concluded that with increasing state budget shortfalls, eventually an increase in taxes will occur, ultimately creating more demand for municipal bonds. More clarity should be coming next week around how the new relief package will affect states’ balance sheets.
*Disclosure on all charts – Figures shown above are the weighted aggregate of bonds that currently have an IDC price and based off transactions over the past 2 weeks. This will create for anomalies in the data but aligns with our effort to reflect actual market conditions.
Want to get this in your email every Sunday? Sign up to receive The Fixed Income Brief weekly.
This paper is intended for information and discussion purposes only. The information contained in this publication is derived from data obtained from sources believed by IMTC to be reliable and is given in good faith, but no guarantees are made by IMTC with regard to the accuracy, completeness, or suitability of the information presented. Nothing within this paper should be relied upon as investment advice, and nothing within shall confer rights or remedies upon, you or any of your employees, creditors, holders of securities or other equity holders or any other person. Any opinions expressed reflect the current judgment of the authors of this paper and do not necessarily represent the opinion of IMTC. IMTC expressly disclaims all representations and warranties, express, implied, statutory or otherwise, whatsoever, including, but not limited to: (i) warranties of merchantability, fitness for a particular purpose, suitability, usage, title, or noninfringement; (ii) that the contents of this white paper are free from error; and (iii) that such contents will not infringe third-party rights. The information contained within this paper is the intellectual property of IMTC and any further dissemination of this paper should attribute rights to IMTC and include this disclaimer.
Related articles

January 6, 2025