The Fixed Income Brief: May Day Mayday
Job gains stall in April, but investors see the break in the recent positive trend in unemployment as only temporary.

May 9, 2021
Fixed Income Trivia Time: At the turn of the century, what was the average Aaa corporate bond yield? What is it today?
The world’s beacon for economic activity is shining a little less bright this week as the U.S. saw a significant slowdown in the pace of employment gains in April. The much-anticipated non-farm payroll figure that some estimated to be over an additional 1 million jobs actually saw only +266k jobs added and the unemployment rate, anticipated to decline, instead picked up +0.1% to 6.1%. The recovery unfolding in the U.S. has been a sticky point for fixed income investors as they continue to look for inflationary impacts on the back of employment gains. Despite the poor headline number, the April report showed average hourly earnings rate, which measures the change in the price businesses pay for labor not including the agricultural sector, shoot up by +0.7% MoM and +0.3% YoY, exceeding expectations of +0.1% and -0.4% respectively. This is the highest monthly uptick since December’s figure (+0.8%) and far above the 12-month average of +0.1%. The problem is not the recovery stalling, but business’ ability to attract workers who aren’t ready to return to the workforce; many remain cautious around the virus and have the ability to sustain themselves given the extension of enhanced unemployment benefits and recent stimulus checks, therefore disincentivizing applications to help at businesses struggling to hire.
The rest of the economic data this week shows continued return to greater activity in developed nations as Global Markit PMIs exceeded expectations with the U.S. Services the key bellwether, coming in at 64.7 vs. 63.1 exp. Germany’s manufacturing sector, which is a key driver of Europe’s economic engine, saw factory orders exceed expectations at +3.0% vs. +1.7%, and the highest increase since last August. Weekly jobless claims continue to improve, coming in at 498k; it’s the first time below 500k since March 19th, 2020 and has been averaging 544k for the last 4-weeks, which is still double the pre-pandemic levels.
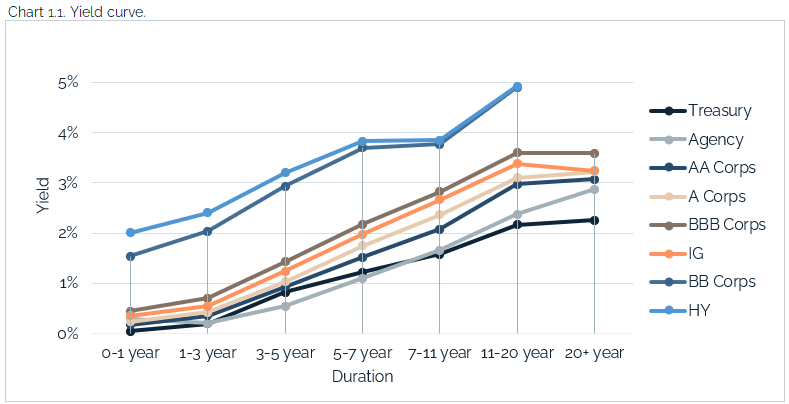
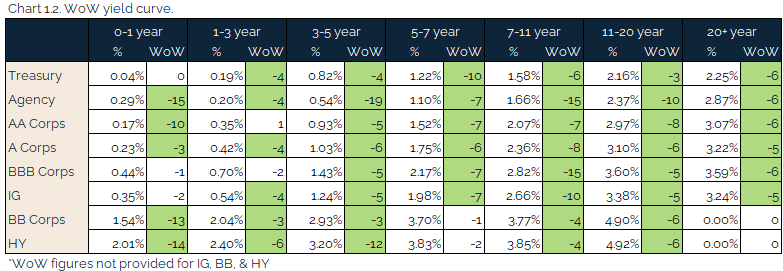
Rates finish the week lower, remain at lower end of recent range
The past week saw the U.S. 10-year fall -5bps WoW as investors remained in wait-and-see mode leading up to the jobs number today. Following the April’s jobs report, the curve steepened slightly with the front end of the curve moving lower and the 10-year yield rising +2bps, despite an initial -8bps decline briefly to 1.49%. The key benchmark ended the week at 1.58%, towards the lower end of its trading range for the past several weeks.
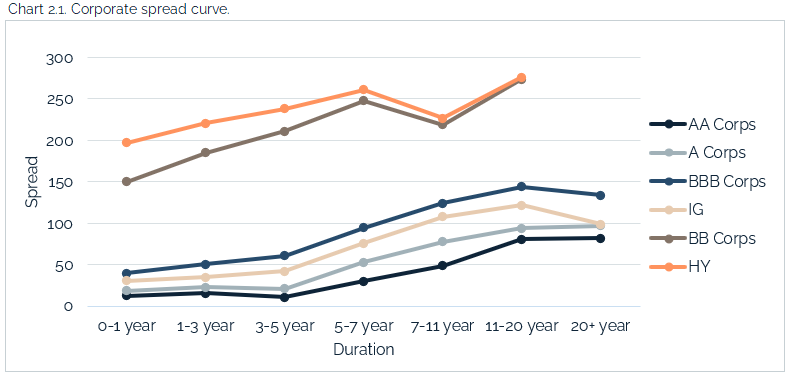
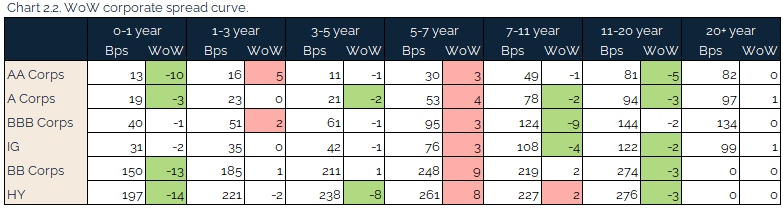
Spreads were flat going into a weak jobs number
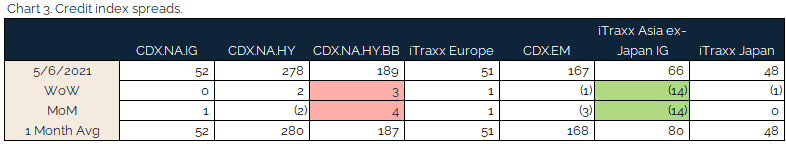
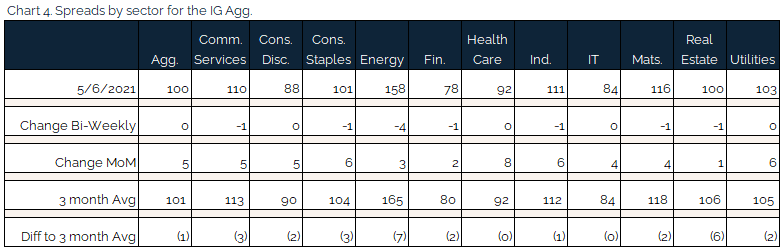
Credit spreads were modestly flat WoW moving into the jobs number. iTraxx Asia ex-Japan saw the first significant tightening in months as it ended 14bps tighter. In NA, it looks like credit spreads will end the week flat to modestly down after the market consumes the jobs report and heads into the weekend. The energy sector was the big winner as the IG sector tightened 4bps on the back of rising oil prices (+1.55% on the week).
Agg was flat going into Friday morning as financials and real estate are still the winners MoM. Idiosyncratic winners this week were mostly from energy names like Archer-Daniels and Occidental. Losers for the week were retail names like Staples and Kroger.
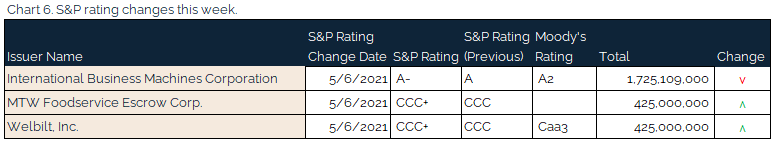
Quiet week for upgrades / downgrades
Benign week for rating changes. IBM had their unsecured senior lien debt downgraded to A- from A by S&P.
Muni yields move lower, potential supply in May seen as a relief
Muni yields moved lower this week as fundamentals continue to improve on stimulus and re-openings, along with demand staying higher due to anticipated tax rates and muni ‘safe haven’ status after an aggressive run up by equities. Municipal bond fund managers continue to see tight supply and heavy demand. The market is anticipating heavy new issuance in May, expecting $42bn vs an average of $38bn. The sense is that there is more than enough appetite currently to take down the issuance as most new issue paper is oversubscribed by 2-3 times.
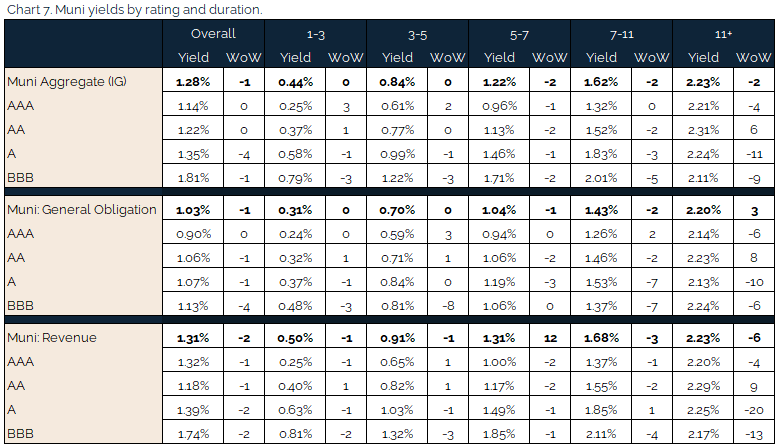
*Disclosure on all charts: Figures shown above are the weighted aggregate of bonds that currently have an IDC price and based off transactions over the past 2 weeks. This may create anomalies in the data but aligns with our effort to reflect actual market conditions. Data pulled as of end of day Thursday, May. 6, 2021.
Fixed Income Trivia Time Answer: January 2000 – 7.75% | May 2021 – 2.90%
Want to get this in your email every Sunday? Sign up to receive The Fixed Income Brief weekly.
This paper is intended for information and discussion purposes only. The information contained in this publication is derived from data obtained from sources believed by IMTC to be reliable and is given in good faith, but no guarantees are made by IMTC with regard to the accuracy, completeness, or suitability of the information presented. Nothing within this paper should be relied upon as investment advice, and nothing within shall confer rights or remedies upon, you or any of your employees, creditors, holders of securities or other equity holders or any other person. Any opinions expressed reflect the current judgment of the authors of this paper and do not necessarily represent the opinion of IMTC. IMTC expressly disclaims all representations and warranties, express, implied, statutory or otherwise, whatsoever, including, but not limited to: (i) warranties of merchantability, fitness for a particular purpose, suitability, usage, title, or noninfringement; (ii) that the contents of this white paper are free from error; and (iii) that such contents will not infringe third-party rights. The information contained within this paper is the intellectual property of IMTC and any further dissemination of this paper should attribute rights to IMTC and include this disclaimer.
Related articles

January 6, 2025