The Fixed Income Brief: Bond Markets Remain in Risk-off Mode
Fixed Income Trivia Time: In what year did the US see the largest YoY increase in inflation?
Fed Chairman Jerome Powell was as direct as he could be at his mid-week press conference when answering questions about what can be done to improve the economic situation for those most hard-hit by this pandemic. Powell has persistently alluded to the fact that monetary policy can only do so much and that offering cheap borrowing terms only goes so far in bolstering the economy. The FOMC’s message stayed on point this week as Powell reiterated that the outlook remains highly uncertain and this means leaving rates at zero indefinitely, tolerating potentially higher inflation, and not planning on diffusing any asset bubbles anytime soon. Given where markets stand versus the dark days of the early Spring, the Fed has proven that it is doing everything in their power to ensure that markets remain functional and lending conditions remain accommodative. Powell gave a lot of credit to Washington’s initial pandemic response, stating that the speed and size of the initial fiscal stimulus package is why the economy and markets have broadly recovered today. He stressed though that more fiscal support is needed to handle roughly 11 million unemployed due to the virus and that they need additional support as small businesses, mainly customer facing ones, struggle to recover. Powell also alluded to the fact that state and local governments need to be supported by Washington to keep the momentum going and to spare them from cutbacks which would equate to further job losses. The situation is that most market and economic projections have some additional fiscal support baked in as a done deal, therefore, if Washington does not come through on a package, a correction could take place as investor outlooks become less optimistic for a sustainable recovery.
Recent global economic data has been mixed with China seen as emerging from the pandemic a lot faster than the rest of the world. Chinese industrial production beat analyst estimates with a +5.6% YoY uptick versus a year ago and local economic activity seems to be returning to levels seen prior to the pandemic. All this while Europe struggles to deal with the virus as areas are contemplating additional lockdowns as the spread of cases picks up in pockets across the region. On the economic front, the recent EUR appreciation has not helped to fend off disinflation as CPI reported from August showed a decline of -0.4% MoM and -0.2% YoY, despite the fact that the ECB continues with negative rates and sustained open market purchases of debt.
Here in the U.S. investors saw worse than expected industrial production figures YoY (0.4 v 1.0% exp.) and saw weaker retail sales for August (+0.6 vs 1.0% exp). Jobless claims for the week were in-line with expectations at +860k but remain elevated; claims for last week were also revised slightly higher (+893k vs +884k).
Overall, there is a sense that the market is losing steam here and added geopolitical risks continue to nag at markets in addition to the major U.S. general election and trade tensions persisting with China. The economy and market seem to need a U.S. fiscal stimulus package to keep things moving forward during these uncertain times, but Washington does not seem to be up to the challenge of making this a reality.
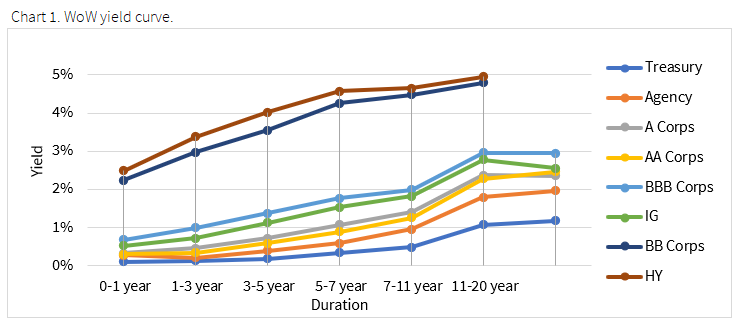
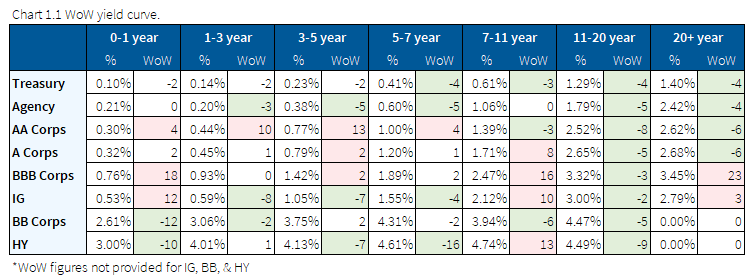
Yield curve flattened slightly on back of mixed economic data and FOMC meeting
U.S. Treasuries were stable and slightly lower this week, with the 10-yr note trading in a narrow 5bps range (.65-.70) as investors digested mixed economic data, the FOMC meeting, and the risk-off tone in equity markets. The yield on the two-year note is 0.14%, while the rate on the benchmark 30-year bond is 1.43%. The curve slightly bull-flattened with the short end lower by -2bps, the belly lower by -3bps, and the long end lower by -4bps. Longer term, Moody’s outlook for the 10 year is to remain under 1% due to stubbornly high unemployment and the global economy expected to operate below trend for the foreseeable future.
Spreads stable over the week as investors digest the Fed and other geopolitical risks
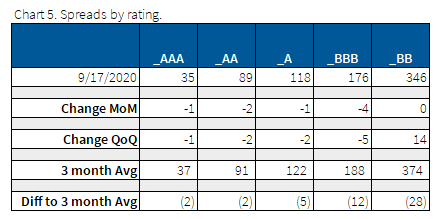
All major credit indices traded flat to tighter on the week. The large drivers of tightening came from Hovnanian Enterprises, American Airlines, and a rebound from cruise operators like Carnival and Royal Caribbean. According to the WSJ, there is unusually high demand for hedges against a credit market selloff, specifically around the election in November .
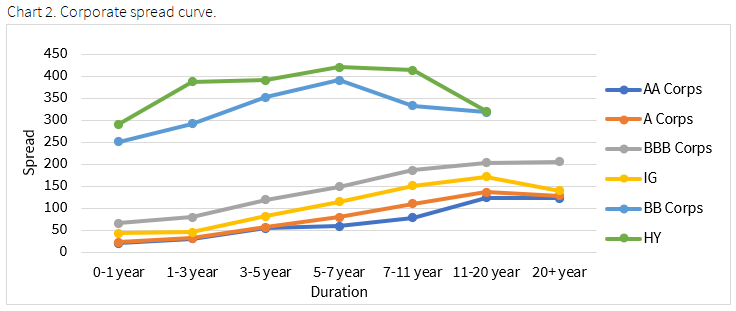


IT remains tighter MoM even after recent headwinds and energy continues to be the biggest loser, even though oil prices have moved higher this week on the back of the hurricanes in the gulf. Largest idiosyncratic IG credit tightening came from FedEx, Danaher, and Oracle. On the flip side Chevron, Tenet Healthcare, and Valero saw credit spreads widen.

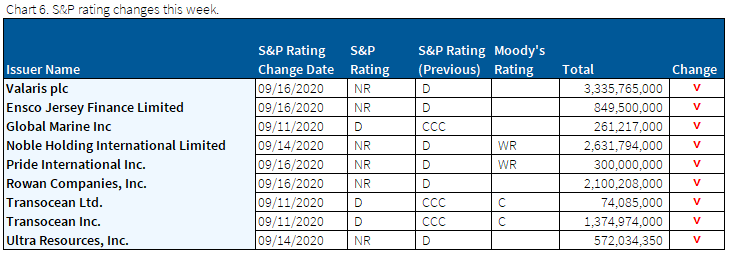
S&P’s downgrade trend continues as Moody’s predicts a 3x increase in default rates YoY
S&P continues its downgrades trend as expectations for softer oil demand begins weighing down credit ratings. According to Moody’s, the trailing 12-month US high yield default rate jumped to 8.7% (August 2020) from 3.1% last year (August 2019); the default rate may average 10.6% during 2020’s fourth quarter.
Munis outperform Treasuries as rates remain stable
Municipal bonds outpaced U.S. Treasuries this week with yields generally lower across the curve, most notably on the long end. Munis continue to be in demand as the market has seen an uptick in supply this past week with ~$7.5bn in issuance vs. the weekly average of $5.8bn. The Bloomberg 30-day visible supply rose by +$1.8bn to $14bn, slightly under the rolling 12-month average of $14.6bn.
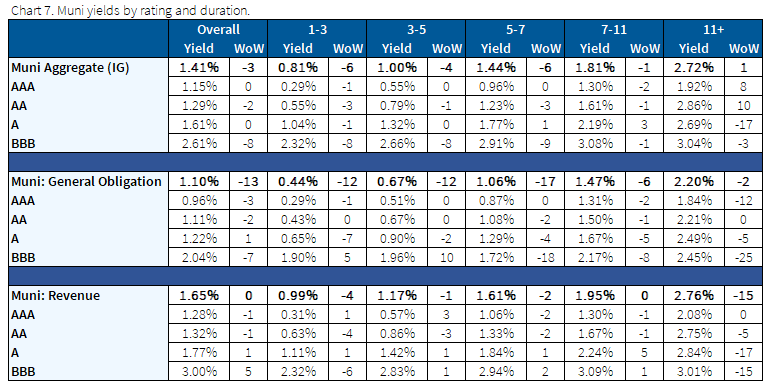
*Disclosure on all charts: Figures shown above are the weighted aggregate of bonds that currently have an IDC price and based off transactions over the past 2 weeks. This will create for anomalies in the data but aligns with our effort to reflect actual market conditions.
Fixed Income Trivia Time Answer: 1946, under Harry Truman
Want to get this in your email every Sunday? Sign up to receive The Fixed Income Brief weekly.
This paper is intended for information and discussion purposes only. The information contained in this publication is derived from data obtained from sources believed by IMTC to be reliable and is given in good faith, but no guarantees are made by IMTC with regard to the accuracy, completeness, or suitability of the information presented. Nothing within this paper should be relied upon as investment advice, and nothing within shall confer rights or remedies upon, you or any of your employees, creditors, holders of securities or other equity holders or any other person. Any opinions expressed reflect the current judgment of the authors of this paper and do not necessarily represent the opinion of IMTC. IMTC expressly disclaims all representations and warranties, express, implied, statutory or otherwise, whatsoever, including, but not limited to: (i) warranties of merchantability, fitness for a particular purpose, suitability, usage, title, or noninfringement; (ii) that the contents of this white paper are free from error; and (iii) that such contents will not infringe third-party rights. The information contained within this paper is the intellectual property of IMTC and any further dissemination of this paper should attribute rights to IMTC and include this disclaimer.


