The Fixed Income Brief: The Fed Leaves Fixed Income Investors In Flux

Fixed Income Trivia Time: The first ever US muni bond was a GO issued by the City of New York. What were the proceeds used for?
U.S. Treasury yields rose this week on the back of decent economic data and the Federal Reserve formalizing their policy “average inflation targeting.” Rather than looking at a 2% inflation target as a threshold to begin to tighten monetary policy the Fed will let inflation run through that threshold. The premise is based on looking at inflation on average over a longer period and since inflation has remained so low as of late, this would allow the Fed to let inflation run above their predetermined comfort zone of 2%. The policy shift gives the Fed more flexibility to support the second leg of its dual mandate to promote full employment – but potentially de-anchoring inflation expectations in the process.
The issue that bond investors will have to grapple with is that it erodes the Central Bank’s standing of not allowing inflation to get too high, which ultimately results in less money back for long-term bond holders in real money terms (inflation-adjusted return). Given all this, it is only natural for an investor to demand more compensation, in terms of yield, for longer dated Treasuries as future expectations for inflation have become less predictable.
The curve steepened on the Fed announcements as the Fed confirmed their commitment to a zero-interest rate policy (ZIRP) for the foreseeable future but left long-term debt holders exposed. The yield on the benchmark 10-year Treasury note broke above its recent range to 0.75% and the yield on the 30-year Treasury bond jumped to 1.50%, both more than +10bps increase WoW. The 2yr and 5yr yields were slightly higher at 0.15% and 0.31% respectively.
Positive economic data earlier in the week also kept risk markets stable. Core durable goods orders were up 2.4% (vs. 2% expected) and two home sales figures both exceeded expectations. Housing has been a big positive towards an economic recovery as it directly benefits from affordability with lower rates as 30-year mortgages are currently below 3.00%. Housing and construction spending is increasing as more individuals improve their home environments during this lockdown.
Treasury yields rise on economic data and Fed changes
The Treasury curve steepened with the 30 year up ~10bps on the week and the 10-year found solid footing above 70 bps. Yields rose earlier in the week on economic data and then continued to rise as the Fed announced average inflation targeting.
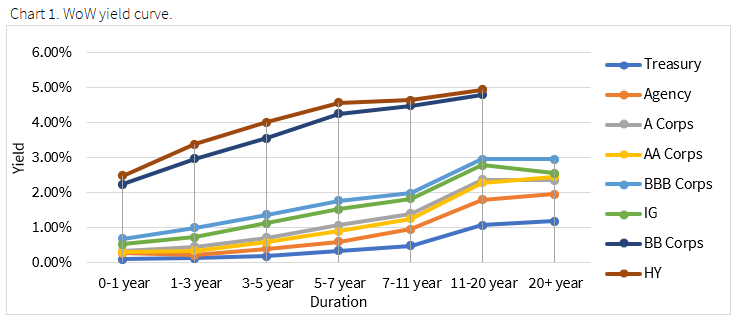
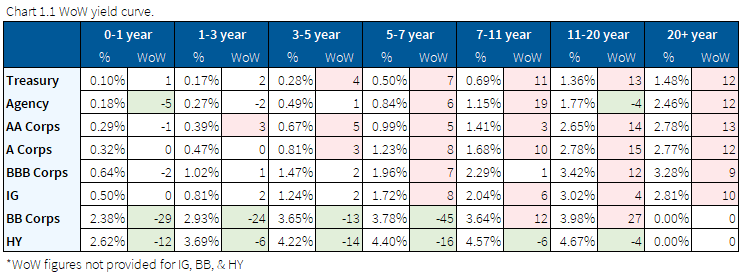
All in yields out the curve rise as spreads are flat to tighter
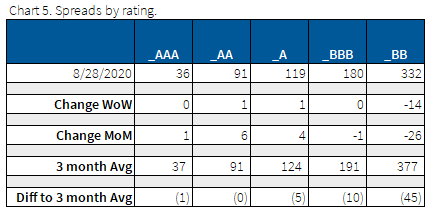
All major credit indices traded tighter on the week as IG bond spreads were flat and HY tightened ~10bps. We continue to see positive market data driving HY spreads tighter as CDX.HY is 54bps tighter on the month relative to 5bps tighter in CDX.IG.
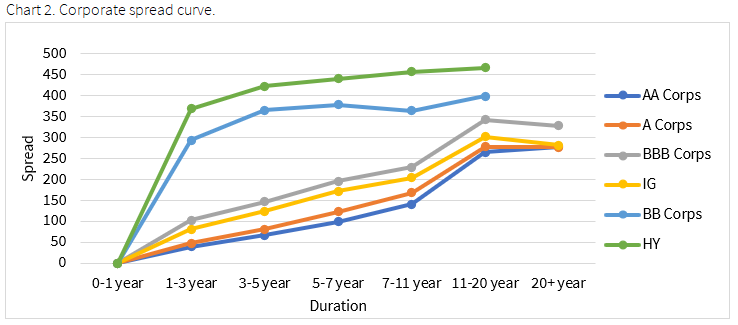


Energy was the winning sector this week as it tightened on the back of oil which is up ~1.5%. Healthcare continues to lag the broader market and is one of the worst performing sectors this month, driven by A and BB issuers.

Airline downgrade foreshadowing future turbulence for the industry?
Downgrades continue to outpace upgrades as expected. Air Canada rating was downgraded, and though not the largest airline (no offense, eh), still signals we may see more airlines continue this trend here in the U.S. as the stimulus support ends in September. Additionally, at this point there’s no hope insight for the second stimulus package.

Muni curves steepen week over week
Municipals yields rose WoW underperforming Treasuries 7 years and shorter but GOs and revenue bonds outperformed on the long-end. The big issuer this week was NYC, which issued a $1.1bn GO, with the bulk of it coming in a 3 year note @.45%.
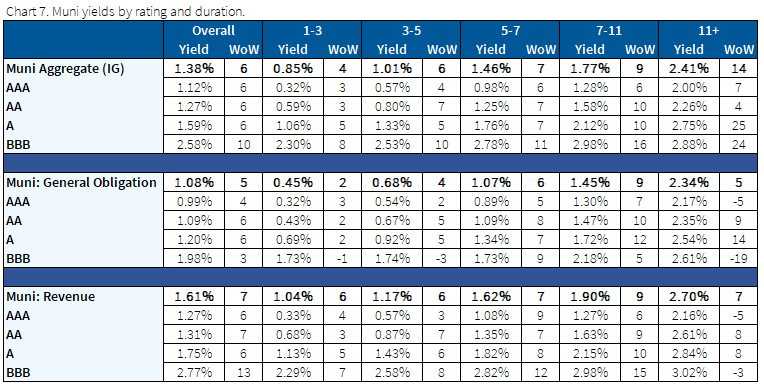
*Disclosure on all charts: Figures shown above are the weighted aggregate of bonds that currently have an IDC price and based off transactions over the past 2 weeks. This will create for anomalies in the data but aligns with our effort to reflect actual market conditions.
Fixed Income Trivia Time Answer: A canal
Want to get this in your email every Sunday? Sign up to receive The Fixed Income Brief weekly.
This paper is intended for information and discussion purposes only. The information contained in this publication is derived from data obtained from sources believed by IMTC to be reliable and is given in good faith, but no guarantees are made by IMTC with regard to the accuracy, completeness, or suitability of the information presented. Nothing within this paper should be relied upon as investment advice, and nothing within shall confer rights or remedies upon, you or any of your employees, creditors, holders of securities or other equity holders or any other person. Any opinions expressed reflect the current judgment of the authors of this paper and do not necessarily represent the opinion of IMTC. IMTC expressly disclaims all representations and warranties, express, implied, statutory or otherwise, whatsoever, including, but not limited to: (i) warranties of merchantability, fitness for a particular purpose, suitability, usage, title, or noninfringement; (ii) that the contents of this white paper are free from error; and (iii) that such contents will not infringe third-party rights. The information contained within this paper is the intellectual property of IMTC and any further dissemination of this paper should attribute rights to IMTC and include this disclaimer.


