The Fixed Income Brief: Long Rates Surge Even as Hospitalizations Surge

Fixed Income Trivia Time: Since 1928, December has historically been the 3rd best month for the % increase of the S&P. Which other two months have better historical average returns?
This disconnect between markets and the newest wave of COVID-19 infections could not be greater. Despite the pace of the recovery slowing and global economies returning to lockdown, investors have been able to see past the current surge towards a future of significant economic upside. This discrepancy of better market returns in a bad news cycle also relates to the vast underpinning of markets by large, public companies that have not only survived, but generally thrived throughout the pandemic. The gap between Main St. and Wall St. is at its peak though help may be on its way in the form of an additional stimulus bill to address the needs of medium to smaller businesses before we lose them for good.
The positive market tone has seen credit spreads continue to compress and U.S. interest rates move higher, up 15% WoW for the U.S. 10 year (currently 0.98%) as we have seen the curve steepen significantly towards February 2018 highs. There are even indications that the Fed may need to consider raising rates sooner than expected given the economic rebound could be so dramatically positive once herd immunity is achieved. Even though estimates leave us 6-9 months from that point, unleashing all of the pent-up demand from quarantined consumers could move the central bank to act sooner than most expect.
Economic data this week has come in mixed but continues to signal the fading jobs recovery needs additional help. The November non-farm payrolls came in at +245k vs. +469k expected with the unemployment rate ticking down to 6.7% vs. 6.9% in October. That is a big miss to the downside, especially given we saw +610k jobs added in October. On the face of it, the unemployment rate trend looks to be going in the right direction, but unfortunately the reason is that more people have fallen out of the workforce with the labor participation rate at 61.5%, down -0.2% versus last month. On the positive side, average hourly earnings were up +0.3% vs. +0.1% expected and now sit at +4.4% YoY which is a healthy sign for the consumer sector as they should have more buying power for this upcoming holiday season. Recent global Purchasing Manager Indices (PMIs) confirm the known fact that Asia continues to recover a lot quicker, followed by the U.S., and then our friends in Europe, which remains in a contractionary pattern given the new lockdown initiatives taking hold there. The addition of newly enacted lockdowns could potentially lead us to seeing a reversal in job growth all together and a complete cooling of the global economy, but the markets are now betting that the vaccine rollouts will come in time to save it before this happens.
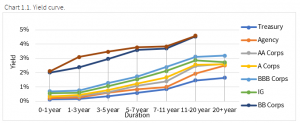
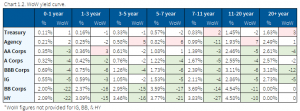
Rates increase, curve re-steepens on the back of positive backdrop
Rates finally took their cue from risk markets and ended the week significantly higher on the back of expectations that the future recovery may be far more robust than originally thought. The front-end still anchored by central bank policy remains low, as we saw the curve steepen with 2/10s now through recent highs (+82bps).
Credit spreads tighten in line with equity rally
High yield has outperformed IG during this rally which has correlated to the equity markets. The Russell 2000 (~+21%) small company index has outperformed both the S&P (~+9%) and Nasdaq (~+10.8%) from the end of September.
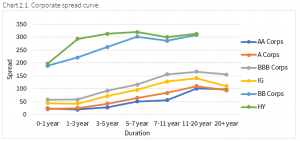


Retail stores like Macy’s, Rite Aid, and Staples have seen positive credit appreciation and outperformed the broader market ending December 3.

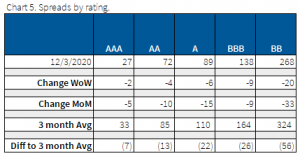
Moody’s default rate jumps and expected to stay elevated in 2021
According to Moody’s Investors Service, the U.S. trailing 12-month high-yield default rate jumped to 8.3% (Oct 2020) from 3.8% (Oct 2019); it is anticipated that it may average 10.3% during 2021’s first quarter.

Munis outperform as a technical perfect storm takes hold
Munis significantly outperformed Treasuries recently on the back of increase investor demand. December’s current projected supply is half of what is normally issued as muni issuers front-ran the election leading up to November. This leaves the near-term supply/demand imbalance significantly skewed in favor of higher muni prices as investor try to find a home for their cash. Investors are sitting on cash because December 1st is a big coupon and maturity payout date versus a supply outlook that is $20bn less than the running three-year average for December ($26.1bn vs $46bn avg). Muni issuance in 2020 remains on course to break the all-time record seen in 2016 ($423.9bn). Expectations for issuance in 2021 are much lower, estimated to be in the $350bn range.
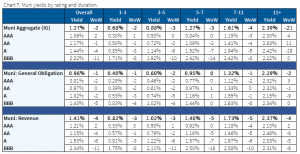
*Disclosure on all charts: Figures shown above are the weighted aggregate of bonds that currently have an IDC price and based off transactions over the past 2 weeks. This will create for anomalies in the data but aligns with our effort to reflect actual market conditions. Data pulled as of end of day Thursday, Dec. 3, 2020.
Fixed Income Trivia Time Answer: July & April
Want to get this in your email every Sunday? Sign up to receive The Fixed Income Brief weekly.


