The Fixed Income Brief: Volatility Picks up as Election Finally Arrives

Fixed Income Trivia Time: What was the largest global corporate bond sale? Name the company, deal value, and year.
If you are like us, you are done hearing about the risks around the election. The problem is investors cannot see past it because of the numerous uncertainties it raises, and the political ramifications seem much more impactful to the real economy at this point as the world tries to emerge from a global pandemic. Regardless of the outcome of the election, the government will still struggle in dealing with a virus that has continued to wreak havoc around the globe. Markets are moving in a more dramatic fashion this week as investors take off risk before Tuesday’s election. Corporate bond spreads widened in IG and more dramatically in HY as markets reversed the sentiment around potential stimulus last week. The stock market is on course for its worst week since March.
It makes sense to see investors hesitate in front of a major election – with the added risks of a delayed outcome and potential unrest no matter who wins at the polls. Add on coronavirus cases reaching a single-day record globally of 500,000 on Thursday, where the U.S. continues to set new highs for infections this week. Thursday marked a record 88,521 daily new cases and hospitalizations are seen rising in 41 states.
On the data front, Personal income rose 0.9% in September, with personal spending rising 1.4% topping estimates of an expected 1.0% gain. U.S. GDP rose by 33.1% in the third quarter, higher than the forecasted 32% growth. Meanwhile, the weekly initial jobless claims came in better than expected at 750k, below the 775k estimate, and the employment cost index gained 0.5% in the third quarter.
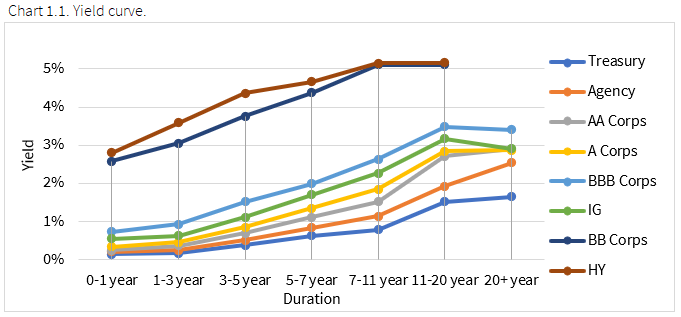
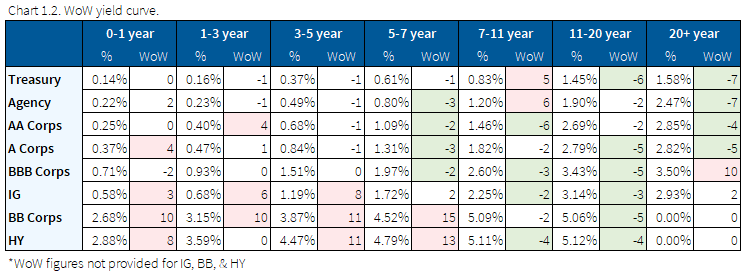
Yields rise across the board as curve steepens
Rates rallied throughout the week before closing about flat-to-up. The bond market saw widespread selling as investors brace for the presidential election next week coupled with better than expected U.S. economic data.
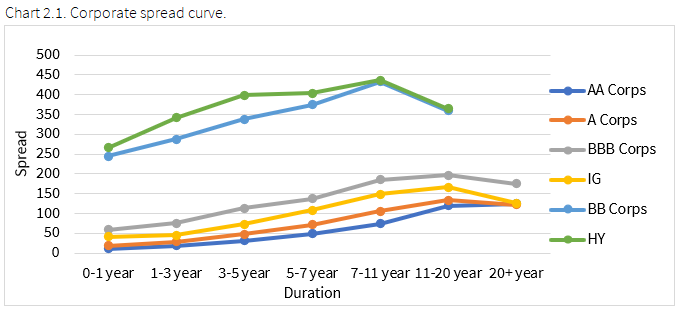
Bond spreads widen as credit indices close the month wider
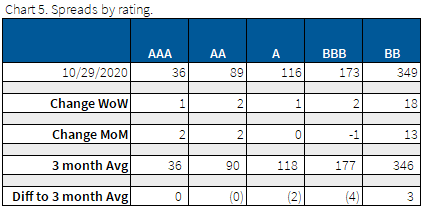
Credit spreads widened across all sectors, led by the energy sector. Oil was down ~10% on the week as COVID-19 induced lockdowns hurt demand. The latest sell-off of equities and credit anticipates a meaningful widespread drop in business sales brought on by COVID’s second wave. Whether such a drop materializes remains to be seen.


Manufacturing’s expansion continues. Because of COVID-19, consumers have switched from the consumption of experiences to the consumption of things. Implied credit strengthening was driven by names like Constellation Brands, Unisys, Nissan, and Intel. Deteriorating credit was driven by travel brands like American Airlines, Carnival, and Royal Caribbean.

Gilead Sciences loses its single A rating
The big downgrade of the week from S&P came from Gilead Sciences, which had $29.5bn downgraded. This downgrade is to account for the company’s $21 billion acquisition of Immunomedics Inc.

Munis seen as safe haven despite higher expected supply
Municipals outperformed Treasuries this past week as supply continues ahead of the election. Wall Street estimates a record $550bn of muni bonds will be issued in 2021, with 70% coming from public works projects instead of refinancing outstanding debt. State and local governments have sold $384bn of long-term bonds so far this year, a 25% increase from 2019. Despite expectations of higher supply, Munis are seen as a safe choice given higher taxes seem inevitable.
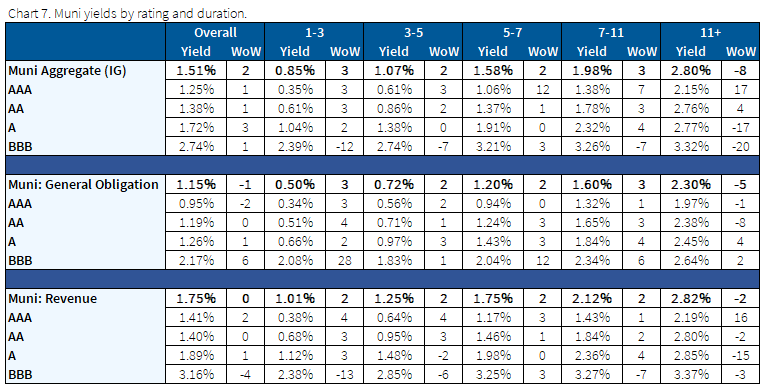
*Disclosure on all charts: Figures shown above are the weighted aggregate of bonds that currently have an IDC price and based off transactions over the past 2 weeks. This will create for anomalies in the data but aligns with our effort to reflect actual market conditions. Data pulled as of end of day Thursday, Oct. 29, 2020.
Fixed Income Trivia Time Answer: Verizon Communications with $49bn in 2013
Want to get this in your email every Sunday? Sign up to receive The Fixed Income Brief weekly.
This paper is intended for information and discussion purposes only. The information contained in this publication is derived from data obtained from sources believed by IMTC to be reliable and is given in good faith, but no guarantees are made by IMTC with regard to the accuracy, completeness, or suitability of the information presented. Nothing within this paper should be relied upon as investment advice, and nothing within shall confer rights or remedies upon, you or any of your employees, creditors, holders of securities or other equity holders or any other person. Any opinions expressed reflect the current judgment of the authors of this paper and do not necessarily represent the opinion of IMTC. IMTC expressly disclaims all representations and warranties, express, implied, statutory or otherwise, whatsoever, including, but not limited to: (i) warranties of merchantability, fitness for a particular purpose, suitability, usage, title, or noninfringement; (ii) that the contents of this white paper are free from error; and (iii) that such contents will not infringe third-party rights. The information contained within this paper is the intellectual property of IMTC and any further dissemination of this paper should attribute rights to IMTC and include this disclaimer.


