The Fixed Income Brief: Eye of the Storm

Fixed Income Trivia Time:
Which states have the highest municipal debt outstanding as a % of state GDP?
The anticipation for further signals around tapering will dominate investors’ thinking through the summer. It feels as though fixed income investors will be content to wait until autumn comes to make any significant moves. The timing and path of how much they pull back will be data dependent and, therefore, could be cause for a choppy ride along the way as the economy digests temporary supply constraints and pent-up consumer demand. In the end, Federal Reserve Chairman Jerome Powell and the FOMC will be looking for further and sustainable progress on the jobs front while keeping a close eye on long-term inflation expectations – given what we know the Fed will be fine with letting the market and inflation run hot, but will the bond buyers? Only time will tell.
The main economic event this week was the core PCE release, which remains the Fed’s key inflation benchmark, and it came in better (lower) than most had anticipated with MoM at +0.5% vs. +0.6% expected and the YoY change was in line at +3.4%. U.S. preliminary PMIs showed a decent drop on the services side (64.8 vs. 70.4) and an uptick on the manufacturing front (62.6 vs. 62.1), with the overall composite off nearly -5pts since May. The key release for next week is the June non-farm payroll number expected to show +675k and average hourly earnings +3.6% versus May. Given all of the headlines about wages needing to go higher to attract more workers, it would not surprise the market to see an even higher jump here.
U.S. rates continue bear flattener trend through Thursday
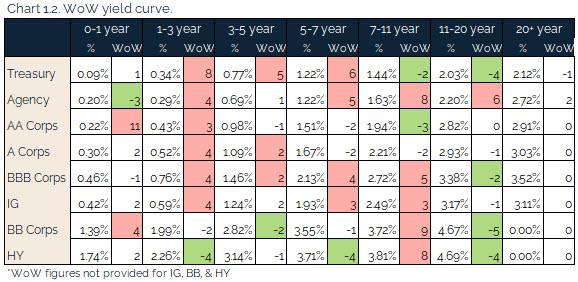
Rates were calmer this week following a Fed-led volatile week last week. The curve continued to rise slightly as the market continues to price in an earlier than originally anticipated taper and ultimate first hike in early 2023.
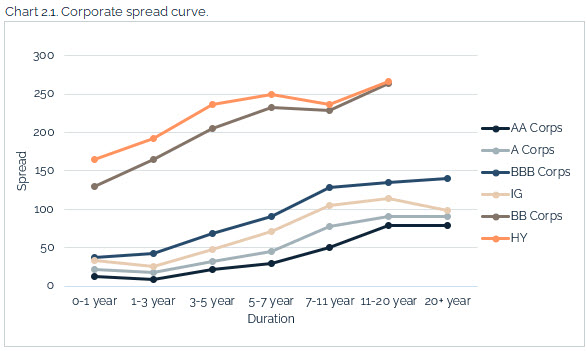
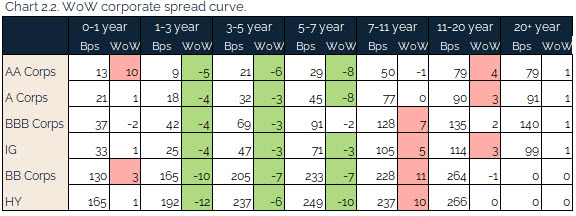
Credit spreads are flat as infrastructure is moot point
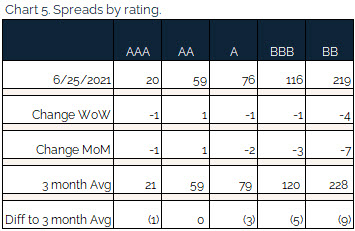
The infrastructure deal is far from final, and if anything, there seems to be less agreement from both parties even after the bipartisan announcement. IG credit and bond spreads were both flat on the week with small tightening in HY and EM. The dot plots for the next hike are back to penciling in a 2023 hike, but the market will be sure to keep an eye on the Fed tapering schedule.


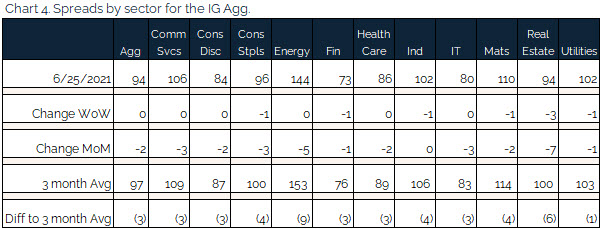
Financials outperformed the broad market as stress test results were published and nothing came out that was not already expected. Reconfirmation of stable balance sheets and approval of dividend payouts are a net positive.
BPCE sees part of debt downgraded
Quiet week for rating moves, but BPCE saw a one notch downgrade on its senior unsecured bonds on the back of earnings.

Muni yields slightly higher WoW
Municipal bond yields rose across the curve this week keeping in line with Treasuries. Muni bond mutual funds inflow were +$1.9bn last week compared to +$2.5bn the previous week as investors paused in the face of the Fed meeting. Expectations remain that some form of an infrastructure bill will get passed but the scale and timing are still unclear. Despite the extra boost the bill would provide for the muni market (i.e., less supply) the fundamentals are already much better than anticipated given the pandemic and snap back in economic activity so investors should not expect to see a significant sell-off if the bill does not get done.
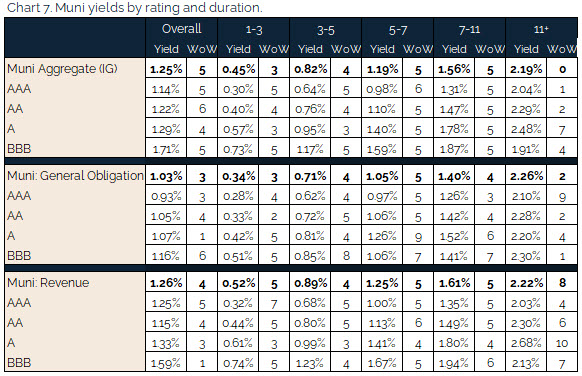
*Disclosure on all charts: Figures shown above are the weighted aggregate of bonds that currently have an IDC price and based off transactions over the past 2 weeks. This may create anomalies in the data but aligns with our effort to reflect actual market conditions. Data pulled as of end of day Thursday, June 24, 2021.
Fixed Income Trivia Time:
1. Connecticut
2. Hawaii
3. Massachusetts
4. New Jersey
5. Missippi
Want to get this in your email every Sunday? Sign up to receive The Fixed Income Brief weekly.


