The Fixed Income Brief: Nickel Ain’t Worth a Dime

Fixed Income Trivia Time:
The WPPSS muni default of 1983 was the second largest in US history. Of the five planned nuclear plants how many were actually built and now operating and how big was the default?
It is like they knew the CPI numbers in advance. FOMC members were out in full force to jawbone the market before and after the much-anticipated CPI release on Wednesday. Their collective aim was twofold, keep fixed income investors from sending long rates significantly higher and buy more time for the Fed’s ongoing unprecedented stimulus.
When asked about the recent pickup in inflationary data, Federal Reserve Governor Lael Brainard remained on message stating, “the outlook is bright, but risks remain, and we are far from our goals [and] as the economy reopens fully and the recovery gathers momentum, it will be important to remain patiently focused on achieving the maximum-employment and inflation outcomes.” Adding to this, St. Louis Federal Reserve President James Bullard carried a similar message. Bullard acknowledged the recent sharp rise in prices, and noted that in order to get longer-term inflation expectations anchored around the Fed’s 2% target, they would need to allow inflation rates to go well beyond the target for an extended period of time. He said, “I don’t think you really want to change policy while you’re still in the pandemic tunnel. Even though you can sort of see the end of the tunnel, we’re not there yet, and we’ve got to push hard till we get all the way to the end.” For now, it looks like all the Fed-speak successfully kept investors at bay, despite a nearly +1% uptick in MoM Core CPI. Though that number came in 3x higher than expected, rates experienced only a small bout of volatility before settling slightly higher over the past five trading days. The problem is that rates do not trade in a vacuum and remain subject to so many forces pushing and pulling that it is hard to decipher if the subdued change in yields can be attributed to other risk-off factors like an escalating conflict in the Middle East, poor Non-Farm Payroll numbers, or the continued struggle for large developing countries to reign in the virus. Only time will tell but, geopolitical events aside, it seems natural for investors to demand more yield in return for taking on duration here.
In terms of economic data this week beyond the CPI print, JOLTS data showed that March Job Openings surpassed 8 million, continuing to support the notion that the uptick in the unemployment rate was due to structural issues and not a stall in growth. Weekly initial jobless claims came in at 473k, further supporting the idea that weak April Non-Farm Payroll numbers may have been an anomaly. U.S. Core Producer Price Index was up +0.7% MoM for the second month in a row and is now +4.6% higher YoY. Producers are more likely to pass on prices increases to consumers, which is why PPI is thought to be a leading indicator of consumer inflation. Stay tuned.
Rates trade in a +/- 20 bps range, end up the week only slightly higher
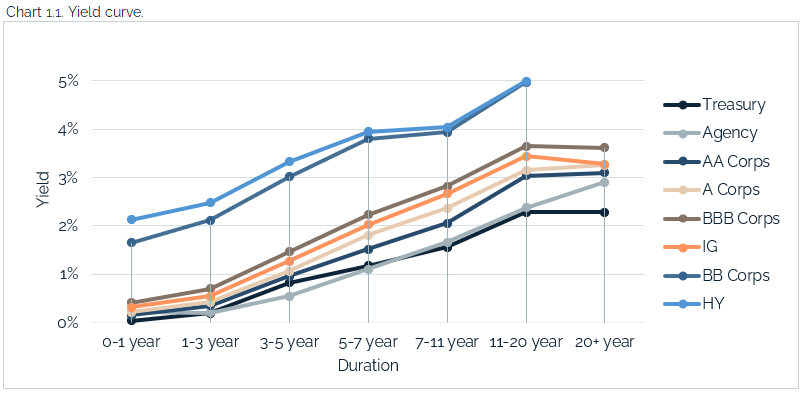
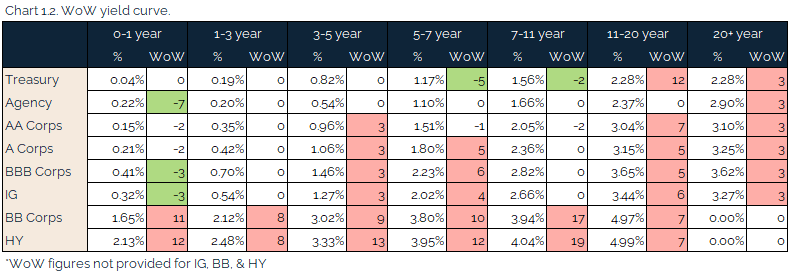
The past week saw the U.S. 10-year rise by +5bps WoW, leaving yields towards the middle of the recently established range between 1.50% – 1.70%. The monthly 10-yr note auction printed at 1.684% following the April CPI print, nearly matching April’s auction that came in at 1.680%. The 2s-10s curve steepened slightly (+4 bps) on the week to +150 bps, still off from March’s high of +159 bps.
HY widens on back of inflation
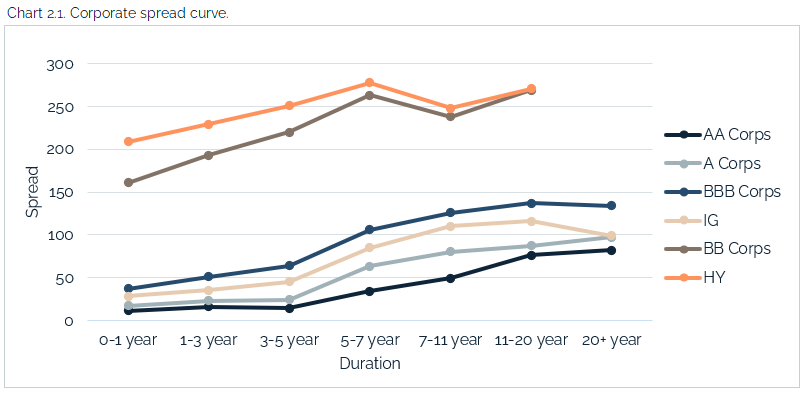
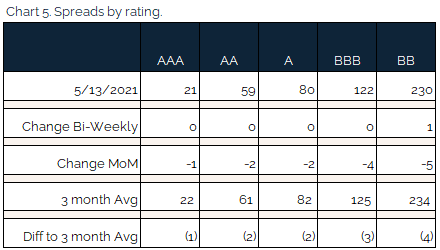
IG credit spreads were modestly flat WoW as a mix of earnings (positive) and inflation data (negative) kept investors balanced. HY investors saw more significant moves, as inflation drove a sell-off in risk. Oil and commodity prices should be monitored closely in the coming weeks. Moody’s recently updated their forecast for HY defaults to under 5% for the rest of 2021, which is a huge shift from their initial call of 10% at the beginning of the year.
Agg is flat on the week, and still only a couple bps wide of its low. Idiosyncratic winners on the week were Verizon, Altria, and Talen Energy. Names that had above average credit deterioration on the week were Domtar corp, Goldman Sachs, and Oracle corps.
Quiet week for upgrades / downgrades
Benign week for rating changes. Sempra Energy gets an upgrade to its unsecured senior lien bonds by S&P on the back of Q1 earnings.
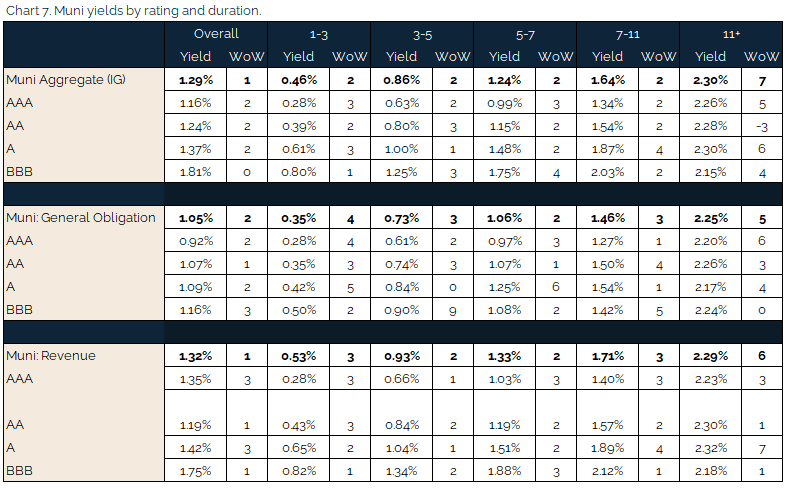
Muni yields move slightly higher, remain well supported
Muni yields moved slightly higher alongside Treasuries but continue to be well bid. Projected issuance remains subdued at $9.7bn, below the seasonal average of $10.5bn with seemingly endless amounts of cash still on the sideline. Again, this trend should be consistent as we move through the summer.
*Disclosure on all charts: Figures shown above are the weighted aggregate of bonds that currently have an IDC price and based off transactions over the past 2 weeks. This may create anomalies in the data but aligns with our effort to reflect actual market conditions. Data pulled as of end of day Thursday, May. 13, 2021.
Fixed Income Trivia Time:
Only one plant became operational in 1984, and the Washington Public Power Supply System was forced to default on $2.25 bn in muni bonds
Want to get this in your email every Sunday? Sign up to receive The Fixed Income Brief weekly.
