Yield Curve Inversion Fuels Recession Debate
The inversion of the 10-year yield curve has sparked debate within the investment community, as market players assess whether a recession is forthcoming.

August 14, 2019
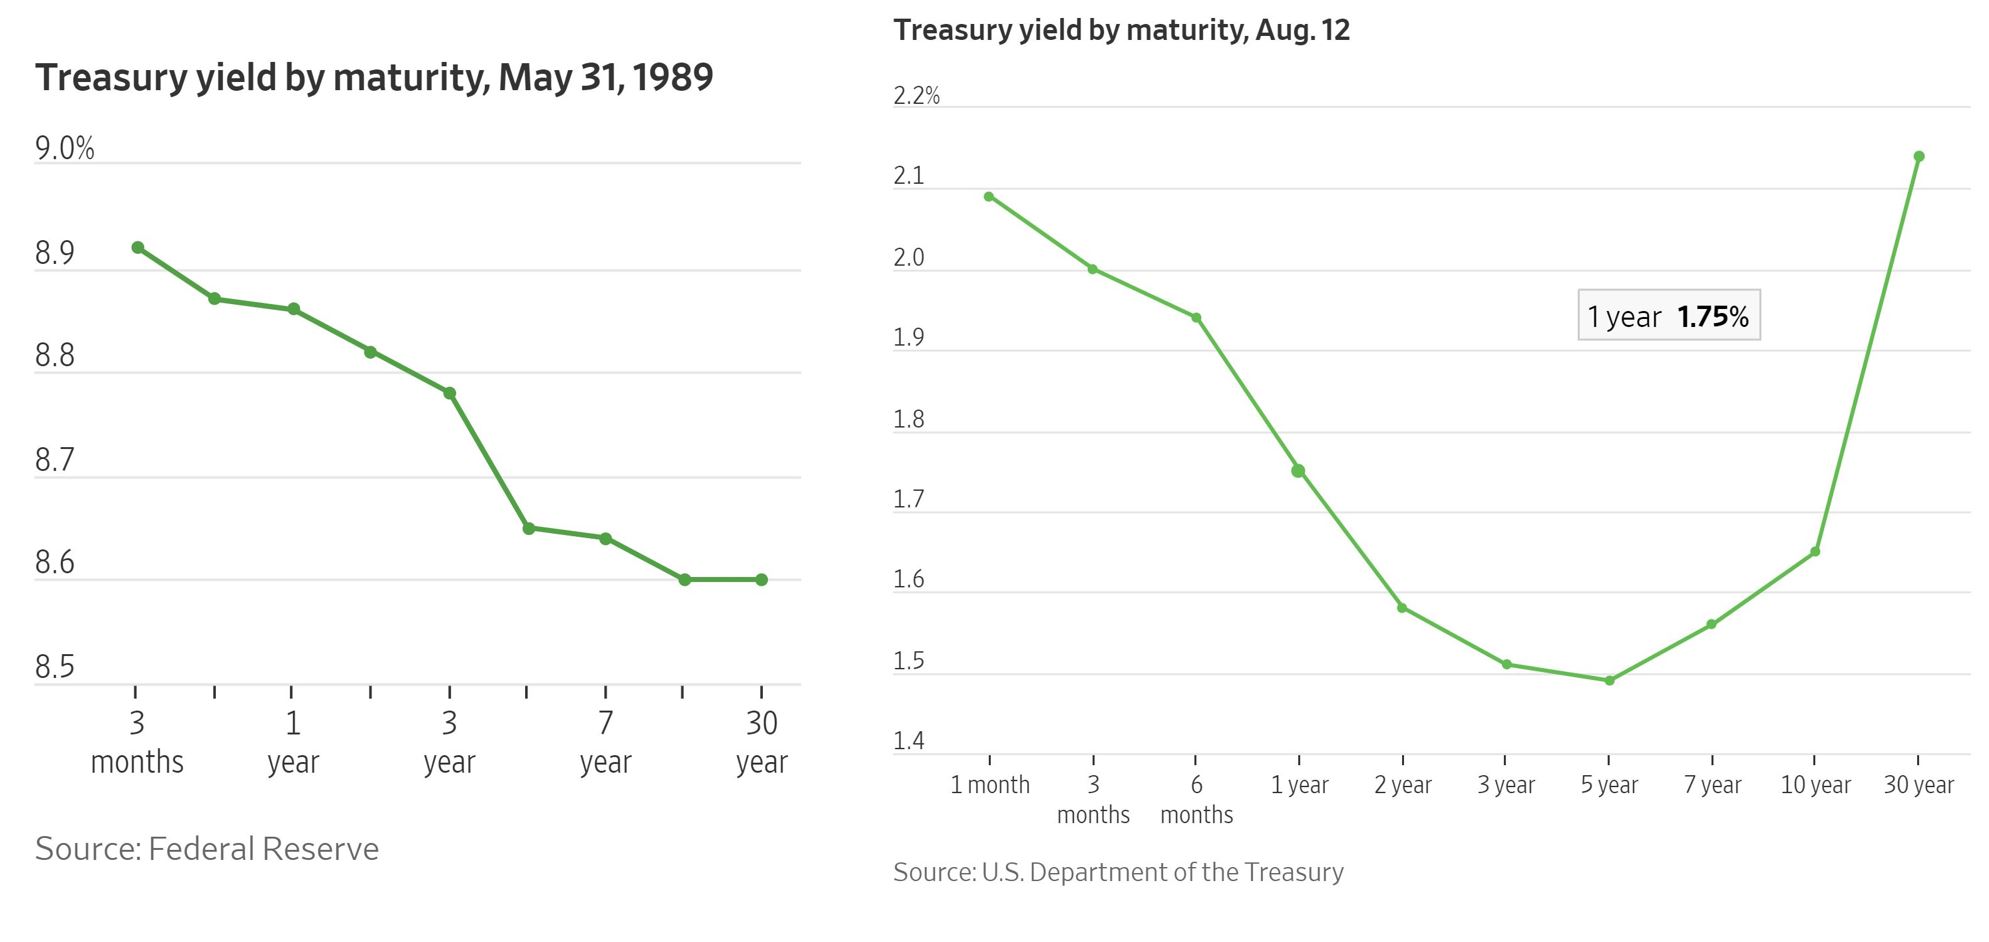
On Wednesday, the bond markets indicated the “biggest recession signal ever” as 10-year Treasury rates falling below 2-year yields. Several reports noted that the yield curve inversion of these particular Treasuries has been a reliable indicator of impending economic slowdown.
For the past 50 years, a recession has typically occurred about two years after the inversion of 10- and 2-year yields, which last occurred in December 2005.
The move sent domestic equities tumbling—the Dow “tanked” more than 800 points in the worst day of the year—and investors sought safe haven in longer-dated paper; 30-year Treasury rates fell to record lows.
However, the expectation of stable, though slow, economic expansion and strong labor metrics led to diverse interpretations of just what inversion signifies on Wednesday. Despite the frenzy, the investment community is debating whether this inversion is a signifies that things will follow the usual pattern. While a Bank of America strategist indicated that the stock market is “on borrowed time,” a Canaccord Genuity analyst declared the curve inversion “an intermediate-term buy signal,” adding that current market weakness won’t last.

Former Fed chief Janet Yellen said the inversion is “most likely not” a strong indicator of recession this time around, since other factors—the escalating US-China trade war and major political headlines from Hong Kong, Argentina and the UK, for example—are also driving lower yields. However, on Wednesday afternoon, US President Donald Trump took current Fed Chairman Jerome Powell to task via social media, tweeting that the Fed is “holding [the US] back” and that the agency raised rates “too much and too fast. Now too slow to cut.”
The markets are now expecting another quarter-point cut in September and hoping for an aggressive easing schedule, although the agency has indicated it is in holding mode and not making any decisions until mid-September.
As mentioned in last week’s installment of the CBXmarket blog, ratings economists are ruling recession odds a toss-up for now: Moody’s Analytics has the likelihood around 50%. In an analysis of various yield curve interpretations, the Wall Street Journal noted that a model based on NY Fed data places the chances of a recession at 32%, which is the highest since the 2008 recession.
Investors were also alarmed by Chinese economic data on Wednesday, as new figures indicated the country’s slowest industrial output grew at its weakest pace in 17 years, and the intensifying trade war isn’t showing any signs of slowing down.
This paper is intended for information and discussion purposes only. The information contained in this publication is derived from data obtained from sources believed by IMTC to be reliable and is given in good faith, but no guarantees are made by IMTC with regard to the accuracy, completeness, or suitability of the information presented. Nothing within this paper should be relied upon as investment advice, and nothing within shall confer rights or remedies upon, you or any of your employees, creditors, holders of securities or other equity holders or any other person. Any opinions expressed reflect the current judgment of the authors of this paper and do not necessarily represent the opinion of IMTC. IMTC expressly disclaims all representations and warranties, express, implied, statutory or otherwise, whatsoever, including, but not limited to: (i) warranties of merchantability, fitness for a particular purpose, suitability, usage, title, or noninfringement; (ii) that the contents of this white paper are free from error; and (iii) that such contents will not infringe third-party rights. The information contained within this paper is the intellectual property of IMTC and any further dissemination of this paper should attribute rights to IMTC and include this disclaimer.
Related articles

January 6, 2025