The Fixed Income Brief: Double Pivot
The Powell/Yellen show was in full effect this week – front running the next Fed meeting to avoid the ongoing debate around the “transitory” nature of inflation.

December 5, 2021
Fixed Income Trivia Time:
True or False: Total public debt as a percent of GDP is lower now than it was Q3 2020.
Just like that, transitory is no longer going to be used by the U.S. Federal Reserve or the U.S. Treasury when describing the current inflation situation. This gives the Fed the flexibility to act more dramatically over the next few quarters in terms of winding down their open market purchases – and investors are now looking for signals from Fed Chair Powell on how closely rate hikes will follow the taper. “The economy is very strong and inflationary pressures are high, and it is therefore appropriate in my view to consider wrapping up the taper of our asset purchases…perhaps a few months sooner,” Mr. Powell said this past week. The Fed will meet on December 14th & 15th, and this should set the tone for rates through the end of the year.
Fed speakers were out in force this week attempting to shift the assumptions of the market as to when and how many rate hikes are expected to come in 2022. Given that the negative tone stemming from COVID-related news has kept treasury bonds well bid, this feels more like an opportunistic window the central bank is using to address (1) real inflation concerns and (2) potentially re-load open market purchase power if needed down the road.
On top of this, November’s non-farm payroll report, despite the negative headline number, supports a faster unwind if needed. Employers added 210k jobs in November vs an average of 555k a month over 2021. Despite the recent uptick in the labor participation rate to 61.8% from 61.6%, the number of individuals looking for a job has yet to move the rate back to pre-pandemic levels of 63.4%, hence the significant gap in employers trying to fill open positions. This has resulted in the headline unemployment rate dropping to 4.2% in November from 4.6% in October and 6.7% one year ago, also impacting wage inflation in the process. An alternative measure of unemployment and underemployment, which includes those who have stopped looking and those in part-time jobs who want full-time positions, dropped to 7.8% in November from 8.3% in October. It fell as low as 6.8% in late 2019 before the pandemic.
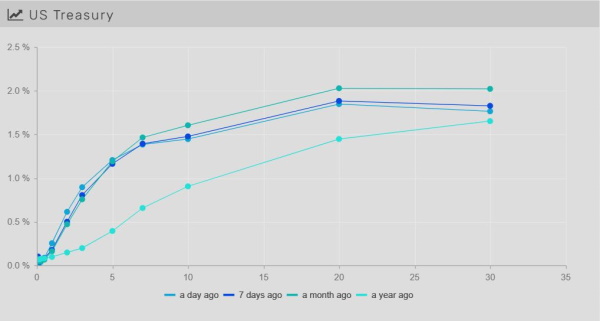
Rates drop on COVID and November jobs report
Long rates trended down throughout the week as COVID news put investors on the backfoot and the November payroll report came out, so the whole curve lowered further. The curve flattened dramatically with the 30yr and 10yr leading the way, lower by ~-20bps WoW. The 2yr and 5yr were trending flattish prior to the release before seeing decreases of -3 and -8bps respectively. The 2yr got as high as 0.65% before retreating to close out the week at 0.59%, with the 5yr, 10yr, and 30yr ending at 1.13%, 1.35%, and 1.68% respectively. This is the lowest the 30yr has been since March 2021.
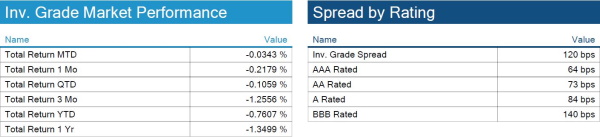
IG spreads wider on CPI rises, employment numbers, and Omicron
Credit spreads are hovering around 12-month highs as COVID concerns are coupled with the potential of higher inflation for a longer period of time. Rate hike probabilities are increasing and total return remains negative on the year and on the quarter. Budget reconciliation and COVID fears should drive spreads going into the year-end.
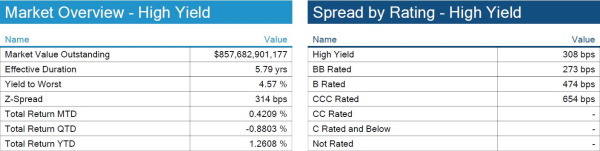
High yield spreads remain steady
Unlike IG spreads, high yield bonds are slightly tighter on the week. Not much has changed over the past two quarters for high yield spreads as default probabilities continue to decrease month over month.

No investment grade S&P rating changes
No upgrades or downgrades to IG names this week by S&P.
Muni returns rebound in November as outlooks are supportive into 2022
Municipal bond market performance saw a nice rebound in the second month of the quarter as demand continues to outstrip supply. As more year-end commentary comes out, it looks like market participants are expecting muni debt supply for 2022 to be slightly higher than 2021, ranging from ~$425bn to $450bn, with Bank of America coming in as an outlier at $550bn. States and local governments have sold about ~$422bn to date.
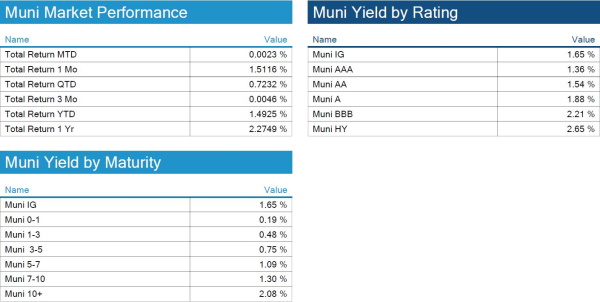
*Disclosure on all charts: Figures shown above are the weighted aggregate of bonds that currently have an IDC price and based on transactions over the past 2 weeks. This may create anomalies in the data but aligns with our effort to reflect actual market conditions. Data pulled as of end of day Thursday, December 2, 2021.
View full IG, HY, and muni market reports pulled from IMTC:
Fixed Income Trivia Time:
True: Q3 2020 – 127.47% / Q3 2021 – 122.60%
Want to get this in your email every Sunday? Sign up to receive The Fixed Income Brief weekly.
This paper is intended for information and discussion purposes only. The information contained in this publication is derived from data obtained from sources believed by IMTC to be reliable and is given in good faith, but no guarantees are made by IMTC with regard to the accuracy, completeness, or suitability of the information presented. Nothing within this paper should be relied upon as investment advice, and nothing within shall confer rights or remedies upon, you or any of your employees, creditors, holders of securities or other equity holders or any other person. Any opinions expressed reflect the current judgment of the authors of this paper and do not necessarily represent the opinion of IMTC. IMTC expressly disclaims all representations and warranties, express, implied, statutory or otherwise, whatsoever, including, but not limited to: (i) warranties of merchantability, fitness for a particular purpose, suitability, usage, title, or noninfringement; (ii) that the contents of this white paper are free from error; and (iii) that such contents will not infringe third-party rights. The information contained within this paper is the intellectual property of IMTC and any further dissemination of this paper should attribute rights to IMTC and include this disclaimer.
.
.
Related articles

January 6, 2025