The Fixed Income Brief: Inflation Not So Transitory – For Now
The recent inflation numbers show that ‘transitory’ may have only been wishful thinking by the Fed; though the medium-term outlook the central bank is relying on may be under threat, investors are betting that the Fed stays on a steady course as to not disrupt markets.

November 14, 2021
Fixed Income Trivia Time:
How much debt does Evergrande have outstanding? How much of that debt is maturing before the end of 2022?
Wednesday’s inflation figures dominated this week’s market moves as the YoY rise in headline inflation marked a 31-year high as consumer prices continue to be plagued by wage and supply chain issues that seem far from ‘transitory’ at this point. It came in at an eye-popping +0.9% MoM and +6.2% YoY in October vs. +0.4% and +5.4% respectively in September. Fixed income investors focus on the core CPI, where data also came higher than expected, with MoM up +0.6% vs. +0.4% expected and YoY up +4.6% vs. +4.3% expected.
The tone building up to the release was that this would mark the peak of inflation in the cycle; however, following the print and putting more weight on what was heard in recent earnings releases, there is now a growing sense that inflation is here to stay in the medium term. Fed speakers were out after the print, with James Bullard stating that he sees two hikes in 2022, in line with market expectations, although market participants are now putting a higher percentage (44%) of a potential third hike in 2022.
The inflation-related economic data prints will be more interesting to monitor and more impactful on the market heading into the new year, guiding investor sentiment much more so than consumer and economic growth activity figures. Stay tuned.
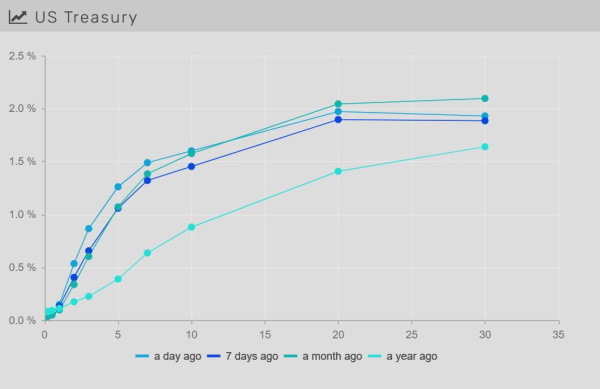
Rates higher as inflation remains sticky
Rates shot up on Wednesday following the October CPI release, with yields higher by about +7-10bps across the curve. The 10-year auction on Tuesday prior to the inflation print came in at 1.444% vs. 1.584% in October. The U.S. 2-10s curve is now at +105bps, -20bps flatter QTD.
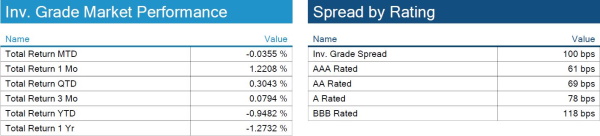
IG credit spreads widen ~5bp WoW
Inflation, rising commodity prices, and supply chain shortages still pose the largest threat to credit, and with much higher-than-expected inflation figures, investors were obviously spooked. Many sectors could see earnings pressure if this trend continues. A lot of new data comes out next week with a busy U.S. economic calendar. Among the key data to be released will be October retail sales, industrial production, and housing starts.
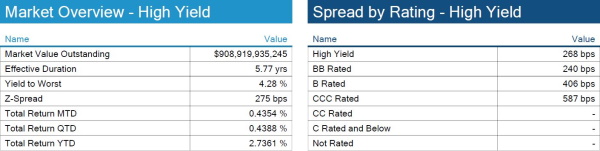
High yield spreads widen ~10bps WoW
High yield bonds widen off of recent tights. To put in perspective, high yield is trading in a range that has been the tightest since 2007. Issuance remains strong, and default probability remains low, but macro risks and contagion from Evergrande could have a large impact on spreads moving forward.

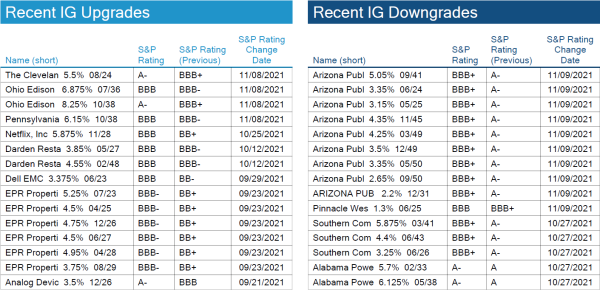
Utility companies’ credit ratings remain active
Utility companies continue to see portions of their debt change in rating. The largest mover this week was Arizona Public Service Company, a subsidiary of Pinnacle West Capital Corporation, sees a downgrade from A- to BBB+.
Munis are back in vogue with expected tax hikes and infrastructure spending on the horizon
Munis had another good week and continue to rebound from a down October. Demand dynamics have continued to ‘improve’ in the municipal market with retail leading the way as pending tax legislation on wealthy individuals could tighten an already imbalanced supply/demand dynamic into the new year as taxpayers await the impact to their 2022 bill. The infrastructure bill will ultimately reduce the need for states to issue debt which will add to the tight muni market technicals going forward.
*Disclosure on all charts: Figures shown above are the weighted aggregate of bonds that currently have an IDC price and based off transactions over the past 2 weeks. This may create anomalies in the data but aligns with our effort to reflect actual market conditions. Data pulled as of end of day Thursday, November 11, 2021.
View full IG, HY, and muni market reports pulled from IMTC:
Fixed Income Trivia Time:
$300 bn, $84 bn
Want to get this in your email every Sunday? Sign up to receive The Fixed Income Brief weekly.
This paper is intended for information and discussion purposes only. The information contained in this publication is derived from data obtained from sources believed by IMTC to be reliable and is given in good faith, but no guarantees are made by IMTC with regard to the accuracy, completeness, or suitability of the information presented. Nothing within this paper should be relied upon as investment advice, and nothing within shall confer rights or remedies upon, you or any of your employees, creditors, holders of securities or other equity holders or any other person. Any opinions expressed reflect the current judgment of the authors of this paper and do not necessarily represent the opinion of IMTC. IMTC expressly disclaims all representations and warranties, express, implied, statutory or otherwise, whatsoever, including, but not limited to: (i) warranties of merchantability, fitness for a particular purpose, suitability, usage, title, or noninfringement; (ii) that the contents of this white paper are free from error; and (iii) that such contents will not infringe third-party rights. The information contained within this paper is the intellectual property of IMTC and any further dissemination of this paper should attribute rights to IMTC and include this disclaimer.
.
.
Related articles

January 6, 2025