The Fixed Income Brief: Stay the Course
Despite a couple of disappointing monthly nonfarm payroll figures, the Fed will likely continue to take steps to initiate the tapering of open market purchases.

October 10, 2021
Fixed Income Trivia Time:
When was the debt ceiling created in the United States and which act was it created under?
Make no mistake: the recent employment numbers have been lackluster, to say the least. Market estimates got ahead of themselves (+366k vs. +750k expected and +194k vs. +500k expected for August and September, respectively), as the projected onslaught of new hires failed to materialize. The thought was that ending the pandemic-induced benefit of additional unemployment compensation would push people back into taking one of the many available jobs, but it is clear there are still more roadblocks to this happening than first thought.
Beyond virus-hesitancy of some workers to return to their jobs, research has demonstrated that childcare has been much harder to obtain, as the pandemic has taken its highest toll on older generations, who in some cases were watching their grandchildren while parents were in office. Statistics project that this has impacted roughly 1 in 4 children, and therefore many families need to have one parent stay home, as the price of childcare has also become a hurdle given persistent worker shortages in that sector too.
For fixed income investors, the key takeaways from the latest employment data relate more to the inflation impact as average hourly wages, which were up +0.6% MoM and +4.6% YoY, continue contributing to the inflation-risk discussion. The wage inflation pressure is just one of many areas the Fed needs to consider as commodity prices and transportation costs continue to increase, much to consumers’ detriment, many of whom are taking the brunt of price increases on goods as companies are able to pass them on.
Pointing to supply-chain disruptions to explain this phenomenon as ‘transitory’ has not worked well for the FOMC, and the recent increases in yields are a sign that investors will demand more compensation for taking on the ‘transitory’ risk of inflation in the meantime.
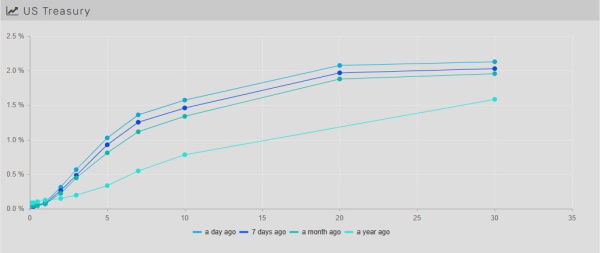
Treasury yields move higher as inflation risk outweighs growth concerns
Treasury yields rose this week on the back of inflationary pressures despite persistent risks to the medium-term growth picture. Rates were up across the board, and the curve steepened, as the U.S. 2yr increased +5 bps and 5yr, 10yr, and 30yr maturities were all up roughly ~ +10 bps. The 2-10s spread started the year around +60 bps and increased to +160 in March and settled back down below +100 bps in July, but it has risen slowly since and has now reached +125 bps. The current state of the curve signals that the Fed will eventually begin to raise rates but that they will not be too aggressive in doing so at this point.
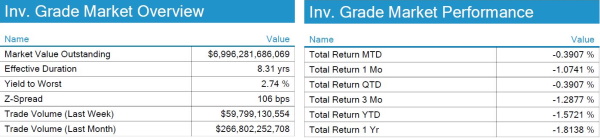
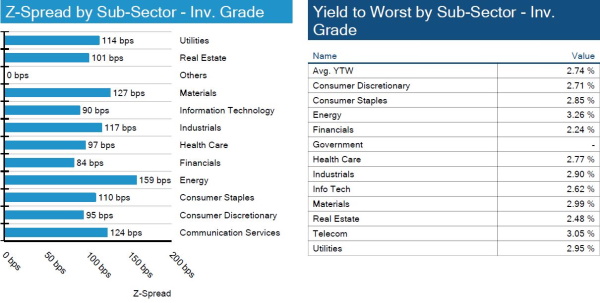
IG credit spreads widen as uncertainty in the short term spooks investors
U.S. IG saw most of the sectors widen on the week. Interest rates are driving the negative total returns, and YTD performance extends another –30 bps week over week.
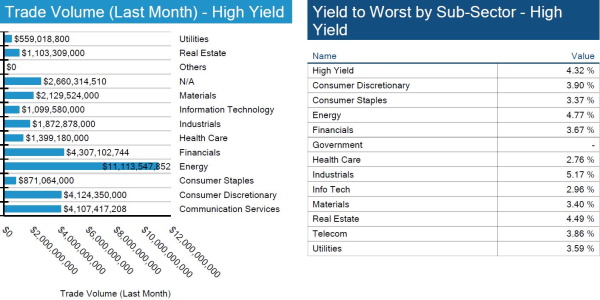
Yields keep rising as trade volume picks up
All-in yields are up another 4bps in the high yield space. Total return YTD remains positive, and investors will keep an eye on inflation and oil prices, two factors that drive hand-in-hand.

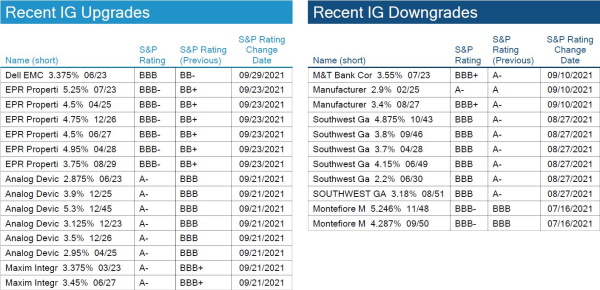
No IG S&P credit changes week over week
There were no significant IG S&P rating changes worth noting WoW.
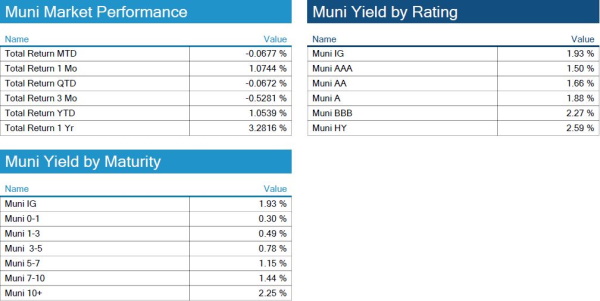
Munis prices lower but outperform Treasuries
Munis, like most fixed income sectors, started the month on the back foot, as the increase in Treasury yields and projected supply has prices lower WoW. The front end of the muni curve remains well-anchored and should outperform the rest of the curve in the near term as the treasury curve is expected to steepen a bit further from here. The secondary markets for municipal bonds in September picked up significantly with $54bn of bonds changing hands just last week alone.
This was the highest secondary trading week since late Q1 and the second largest weekly total flow of the year. The new issue market is expected to pick up over the next 60 days as deals will need to get done before it gets quiet around the holidays. Despite this, the muni sector is still experiencing tight technicals as appetite remains high for tax-exempt income in the face of rising taxes. In addition, ultimate net supply will be hindered by the expected fiscal stimulus, that even though delayed, will ultimately be passed in some form and benefit the State and Local government credit profiles as they will need to borrow less going forward.
*Disclosure on all charts: Figures shown above are the weighted aggregate of bonds that currently have an IDC price and based off transactions over the past 2 weeks. This may create anomalies in the data but aligns with our effort to reflect actual market conditions. Data pulled as of end of day Thursday, October 7, 2021.
View full IG, HY, and muni market reports pulled from IMTC:
Fixed Income Trivia Time:
1917, under the Second Liberty Bond Act
Want to get this in your email every Sunday? Sign up to receive The Fixed Income Brief weekly.
This paper is intended for information and discussion purposes only. The information contained in this publication is derived from data obtained from sources believed by IMTC to be reliable and is given in good faith, but no guarantees are made by IMTC with regard to the accuracy, completeness, or suitability of the information presented. Nothing within this paper should be relied upon as investment advice, and nothing within shall confer rights or remedies upon, you or any of your employees, creditors, holders of securities or other equity holders or any other person. Any opinions expressed reflect the current judgment of the authors of this paper and do not necessarily represent the opinion of IMTC. IMTC expressly disclaims all representations and warranties, express, implied, statutory or otherwise, whatsoever, including, but not limited to: (i) warranties of merchantability, fitness for a particular purpose, suitability, usage, title, or noninfringement; (ii) that the contents of this white paper are free from error; and (iii) that such contents will not infringe third-party rights. The information contained within this paper is the intellectual property of IMTC and any further dissemination of this paper should attribute rights to IMTC and include this disclaimer.
.
.
Related articles

January 6, 2025