The Fixed Income Brief: How Long Will the Fed’s Punchbowl Last?
Rates rose this week in anticipation of any potential signal from Powell around a reduction in the Fed’s extremely loose monetary policy.

August 29, 2021
Fixed Income Trivia Time:
How many ears of corn are on a corn stalk?
Federal Reserve Chairman Powell told markets at the Virtual Jackson Hole Symposium on Friday, August 27th that it will start reducing monthly purchases this year but stressed that this does not signal an immediate rate hike following the conclusion of that program. He acknowledged that the economy had met the pre-condition of “substantial further progress” towards their inflation target and very “clear progress” towards unemployment. Many market strategists believe the next two monthly non-farm payroll numbers (August & September) coming in at or above market expectations will set the tone for the exact timing and pace for the taper to commence. Several Fed officials feel September is the time to act, which was well supported by interviews and speeches this week, albeit from non-voting members in 2021 (Kaplan, George, and Bullard), who already feel tapering should start sooner; this is to avoid continued bubbles and to give the FOMC some dry powder back in case down the road the state of the economy warrants further monetary support. The main wild card here is the impact of the Delta variant as we head into flu season and the potential impact of higher taxes as the White House looks to offset the cost of the $3.5trillion spending package that just made its way through the House.
In terms of economic data, the week started off with Global PMI data showing Europe levels coming in slightly below last month with manufacturing continuing to drive things (61.5 vs 62.8) and services hanging in (59.7 vs. 59.8). The U.S. Services PMI (55.2 vs. 59.9 last month) dragged the composite lower (55.4 vs. 59.9) as the Delta variant is causing some pause in hospitality and travel activity. Core PCE Index (Fed’s preferred inflation measure) came in line with expectations at +0.3 and +3.6% MoM and YoY respectively. The prior release was adjusted +0.1% higher on a MoM and YoY based on revisions to June’s inflation data. Michigan Consumer Expectations preliminary figures remain -14 points lower than prior month (65.1 from 79.0) and Consumer Sentiment remained little changed at 70.3 after July’s -10 point drop. U.S. Q2 GDP came in at +6.6%, slightly under expectations but similar to the Q1 figure of +6.4%. Lastly, U.S. Initial Jobless Claims came in line with expectations at +353k, with the 4-week average at +365k. Next week will be all about the U.S. jobs figures for August.
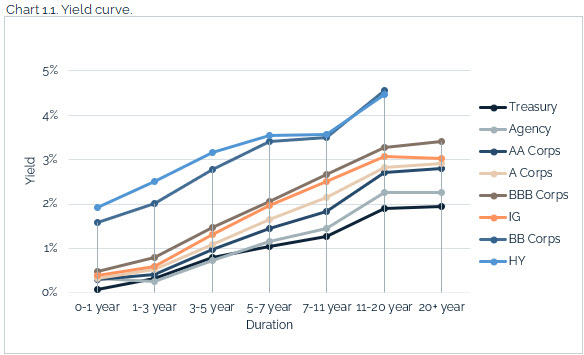
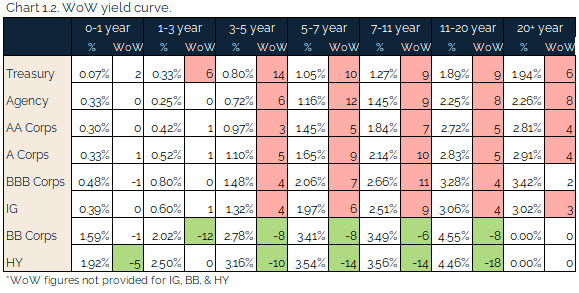
U.S. rates slightly higher this week
U.S. rates ended the week slightly higher this week, with the U.S. 5yr, 10yr, and 30yr up +4, +7, and +6bps respectively. There was a 2-yr note auction that priced at 0.242%, up from last month’s auction at 0.213% and up roughly ~+10bps higher than March’s auction.
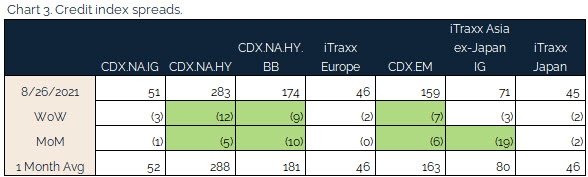
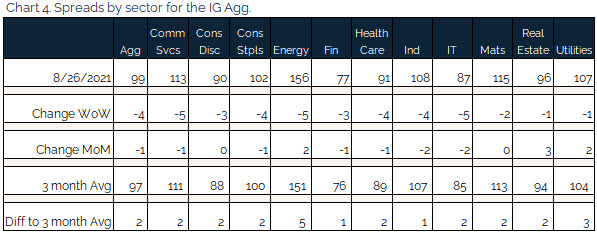
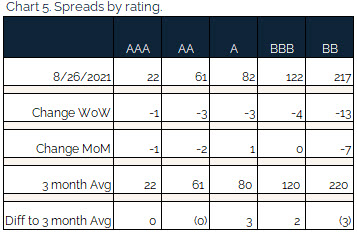
Credit spreads move tighter with focus on infrastructure
U.S. IG remains stable as investors were bullish on infrastructure and largely ignored the Afghanistan situation as it does not directly impact corporate credit. The jobs number on Sept. 3rd will be the next catalyst for the market.
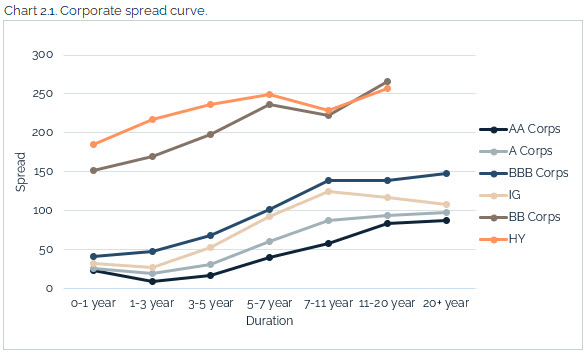
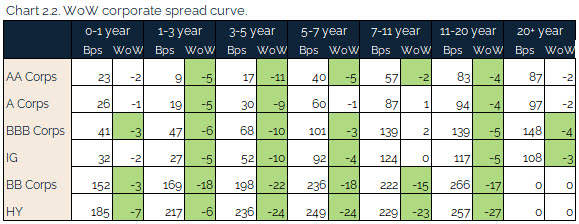
Energy outperformed as each sub-sector ended tighter on the week. Weather forecasts are predicting a slowdown in the supply chain for oil as prices creep higher.
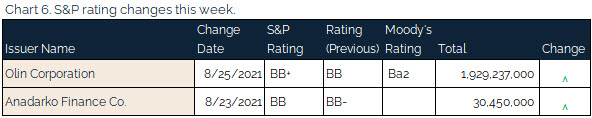
Olin upgraded by S&P
S&P upgraded Olin chemicals as the company released strong earnings for Q2. The stock is up ~50% YTD and continues to outperform market estimates.
Munis yields slightly higher on very little trading
Muni yields rose slightly on the back of Treasury yields, but the same song plays on as demand remains high, future supply remains challenged, and existing bonds are likely to be called on the back of the cash coming from the Federal government. Muni fund managers are flush with cash and are struggling to find bonds to buy. This situation may persist for the next few years if new muni issues fall short of the demand for paper. According to exiting universe stats, roughly 20% of outstanding tax-exempt muni debt will mature or called by the end of 2024. This percentage rises to ~30% by the end of 2026. These figures are higher than historical numbers and will extend the uneven technicals that muni investors are facing to try to roll money back in to an already crowded marketplace. The factors along with the final reality of higher expected taxes at the federal and state level for most should keep muni pricing tight versus Treasuries for the foreseeable future.
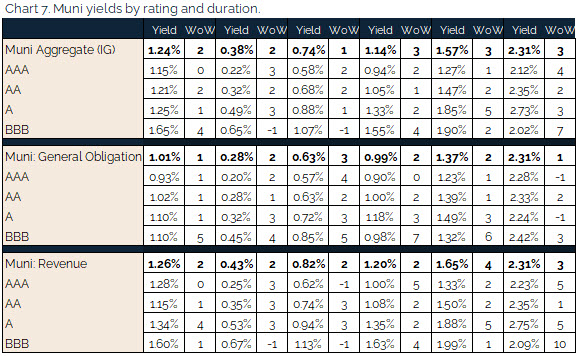
*Disclosure on all charts: Figures shown above are the weighted aggregate of bonds that currently have an IDC price and based off transactions over the past 2 weeks. This may create anomalies in the data but aligns with our effort to reflect actual market conditions. Data pulled as of end of day Thursday, August 26, 2021.
Fixed Income Trivia Time:
One
Want to get this in your email every Sunday? Sign up to receive The Fixed Income Brief weekly.
This paper is intended for information and discussion purposes only. The information contained in this publication is derived from data obtained from sources believed by IMTC to be reliable and is given in good faith, but no guarantees are made by IMTC with regard to the accuracy, completeness, or suitability of the information presented. Nothing within this paper should be relied upon as investment advice, and nothing within shall confer rights or remedies upon, you or any of your employees, creditors, holders of securities or other equity holders or any other person. Any opinions expressed reflect the current judgment of the authors of this paper and do not necessarily represent the opinion of IMTC. IMTC expressly disclaims all representations and warranties, express, implied, statutory or otherwise, whatsoever, including, but not limited to: (i) warranties of merchantability, fitness for a particular purpose, suitability, usage, title, or noninfringement; (ii) that the contents of this white paper are free from error; and (iii) that such contents will not infringe third-party rights. The information contained within this paper is the intellectual property of IMTC and any further dissemination of this paper should attribute rights to IMTC and include this disclaimer.
.
.
Related articles

January 6, 2025