The Fixed Income Brief: Rates Driven by Data
Economic data caused big moves in fixed income markets this week with July’s payroll report leading to higher rates overall.

August 8, 2021
Fixed Income Trivia Time:
As we approach the 14 year anniversary of Lehman collapsing, can you guess the recovery rate on the bonds they defaulted on?
Whether it is economic data or the number of COVID cases that has resulted in hospitalizations, the market has been behaving quite pragmatically as of late. The disappointing ADP private jobs report on Wednesday was seen as a potential canary in the coal mine for Friday’s non-farm payroll and sent longer rates to a near-6-month low. As it turns out, the July jobs number exceeded lofty expectations by +73k (+943 vs. +870k exp.) and an additional +88k revision from June’s report. The uptick in average hourly earnings +0.4% vs. +0.3% expected also provided enough ammo for investors to sell bonds to recalibrate their assessment of when the Fed may begin to taper. Headline unemployment also came in better than anticipated, 5.4% vs. 5.7% expected, and down from June’s 5.9%. The dynamics of the headline unemployment figures are always hard to translate cleanly because sometimes individuals on the dole fall off and are no longer counted despite still being unemployed; however, a positive headline number does tend to bolster business and consumer confidence.
In looking at the price action on bonds this week, given everything we know about the Delta variant spread, more potential U.S. fiscal stimulus, and the shape of the overall global economy, it certainly feels as if the balance of these factors have managed to offset one another. Unless the hospitalizations and deaths revert back to peak pandemic levels, we could remain in this range for quite some time. The next leg to anticipate is when positive data starts to equal negative market sentiment where we will see risk (spreads & equities) selloff and rates move higher as the runway gets cleared for the Fed lift-off in rates. This is why the Fed will remain so very patient, as to not disrupt the risk markets as the global economy continues to heal. Only time will tell if they can thread this needle.
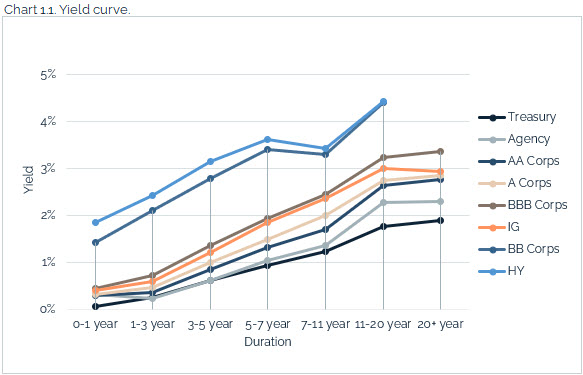
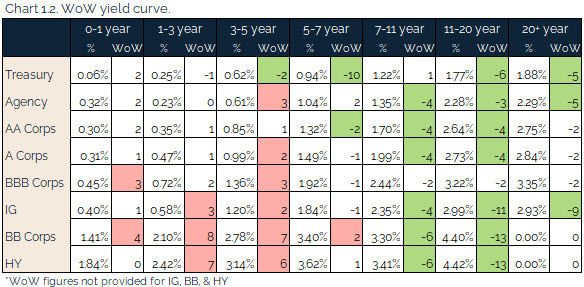
U.S. rates hit near-term lows mid-week but then rise on July’s NFP
The 10-year Treasury hit 1.13% midweek on the back of ADP’s Private Jobs report (330k vs. 653k exp.) and additional risks around the case levels around the Delta variant. Once the NFP reversed this, rates went back to 1.29%. The 1.13% level continues to be the support level for the 10-year, which has yet to break through that level since it was tested in early February.
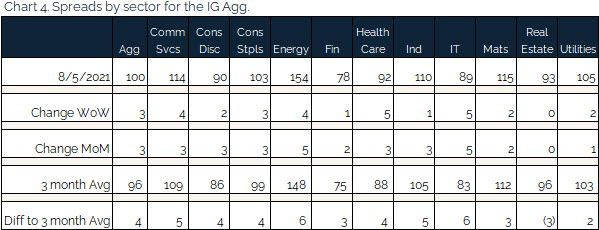
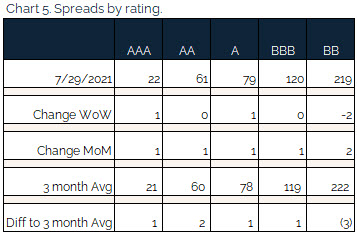
Credit spreads widen as risk concerns elevate
IG was only modestly wider WoW, however high yield and Asia saw a more significant reaction to the risk-off stance investors took this week. IT underperformed the broader market after a strong week last week.
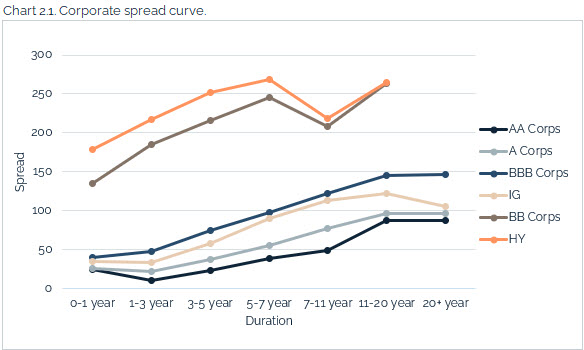
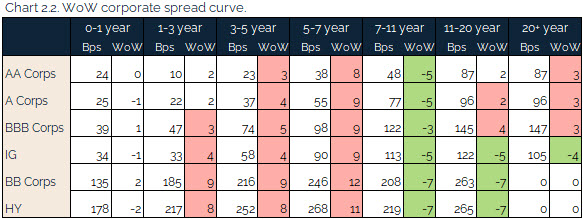
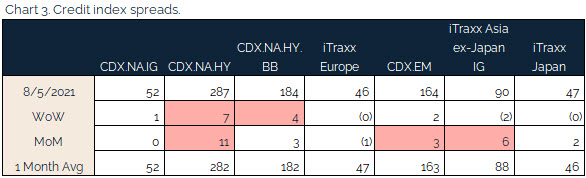
Idiosyncratic drivers in credit spread tightening were Talen Energy, Terminix, and US Steel. Credit spread widening was driven by Carnival and Royal Caribbean on the back of COVID concerns.
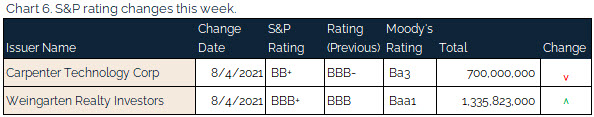
No major upgrades or downgrades
Quiet week for S&P moves in corporate credit with only small tranches of Carpenter Technology and Weingarten Realty Investors seeing moves.
Munis basking in the summer sun
Despite underperforming Treasuries this week through Thursday (8/5), munis stayed the course with issuance remaining paltry versus other fixed income markets. Refinitiv Lipper reported continued inflows into municipal bond mutual funds for the 22nd consecutive week with +$1.2bn flowing into the funds, and high yield saw ~$500mn of that amount. It also marks nine consecutive weeks of flows being greater than +$1bn.
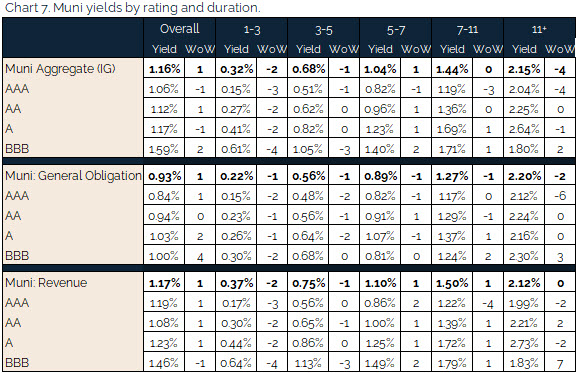
*Disclosure on all charts: Figures shown above are the weighted aggregate of bonds that currently have an IDC price and based off transactions over the past 2 weeks. This may create anomalies in the data but aligns with our effort to reflect actual market conditions. Data pulled as of end of day Thursday, August 5, 2021.
Fixed Income Trivia Time:
21.2%
Want to get this in your email every Sunday? Sign up to receive The Fixed Income Brief weekly.
This paper is intended for information and discussion purposes only. The information contained in this publication is derived from data obtained from sources believed by IMTC to be reliable and is given in good faith, but no guarantees are made by IMTC with regard to the accuracy, completeness, or suitability of the information presented. Nothing within this paper should be relied upon as investment advice, and nothing within shall confer rights or remedies upon, you or any of your employees, creditors, holders of securities or other equity holders or any other person. Any opinions expressed reflect the current judgment of the authors of this paper and do not necessarily represent the opinion of IMTC. IMTC expressly disclaims all representations and warranties, express, implied, statutory or otherwise, whatsoever, including, but not limited to: (i) warranties of merchantability, fitness for a particular purpose, suitability, usage, title, or noninfringement; (ii) that the contents of this white paper are free from error; and (iii) that such contents will not infringe third-party rights. The information contained within this paper is the intellectual property of IMTC and any further dissemination of this paper should attribute rights to IMTC and include this disclaimer.
.
.
Related articles

January 6, 2025