The Fixed Income Brief: Rates Continue Volatility
No summer lull in sight for bond investors as interest rates continue to wreak havoc on investors.

July 25, 2021
Fixed Income Trivia Time:
What was the handle of the 10yr UST when the Olympics were in Atlanta in 1996?
The delta variant’s continued outbreak and negative headlines around relations between U.S. and China put markets on their heels this week; however, earnings outlooks and continued expected stimulus led interest rates to remain relatively unchanged. One thing seems certain here is that inflation risk is no longer a driver of sentiment as it’s back to being all about growth. Next week will be the FOMC’s July meeting. There are low expectations from market participants on a full change of tone, but they should acknowledge the uptick in COVID cases and re-emphasize the transient nature of current higher prices. There is still the potential that the FOMC opens the door to more transparency around the eventual taper that is expected to take place, although, most strategists believe Federal Reserve Chairman Powell is more likely to make headlines around the potential removal of stimulus at his Jackson Hole speech (8/27) or at the FOMC meeting in September (9/22).
Decent data across Europe and the full re-opening of the U.K. have a lot of investors forming a more constructive view on growth despite the COVID risks that remain. In the U.S., preliminary services PMI came in at 59.8 vs. 64.8 expected and dragged down the composite -4 pts. to 59.7. U.S. preliminary manufacturing PMI exceeded expectations at 63.1 vs. 62.0 expected. These measures have a high correlation to near-term activity so the final release will be watched closely to see if these figures show the same slowdown in services. U.S. Initial Jobless Claims ticked back up over +400k this week to +419k vs. +350k expected and far exceeding the recent low print of the +360k last week.
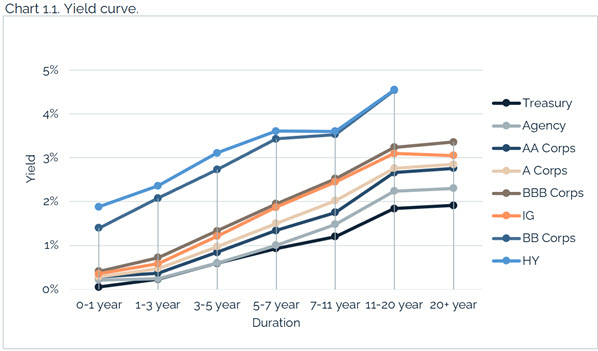
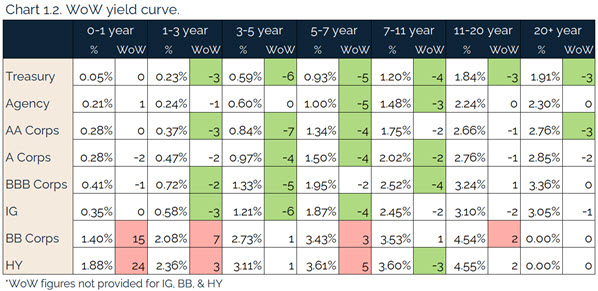
U.S. rates continue to be volatile, 10yr hits lows not seen since February
It was another wild ride in rates – the 10yr Treasury traded as high as 1.32% and as low as 1.14%, ending the week back at 1.30% once again. There are indications that most of the risk-off buying was stemming from Europe as the risks of the delta variant continued to rear its head.
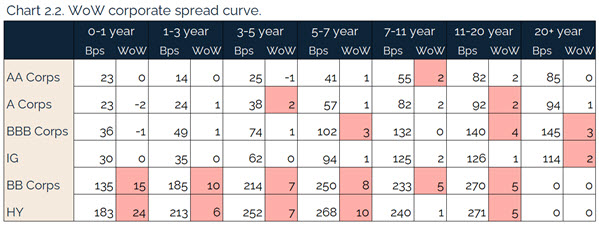
Credit spreads widen as growth concerns persist
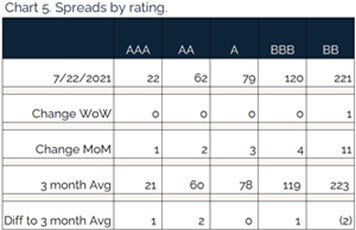
Support for corporates faded slightly this week as investors looked to safer havens. Given the significant spread tightening experienced in credit markets, there was a natural pause here in the midst of earning season and continued headlines around COVID. High quality markets were relatively unchanged, but the HY and EM sectors widened.
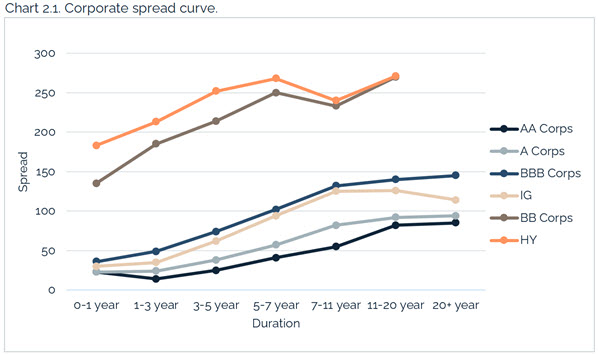
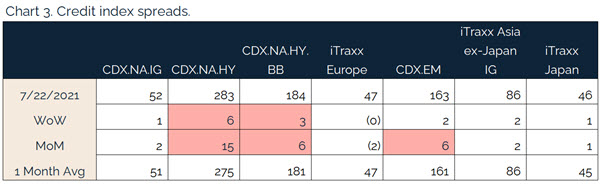
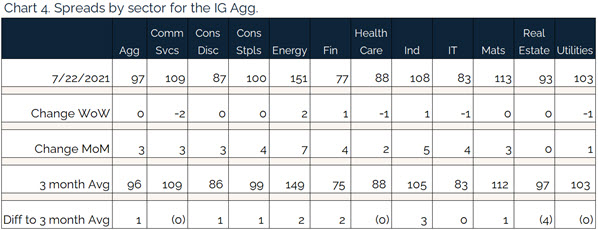
Energy was once again the underperformer on the week and has underperformed the most on the month as well.
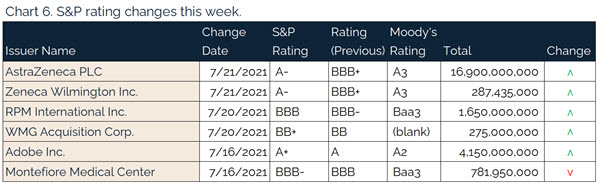
AstraZeneca leads a number of S&P upgrades this week
S&P upgraded AstraZeneca PLC to A- from BBB+ on roughly $17bn of debt for the drugmaker as it continues to be at the heart of the COVID vaccine response.
Munis move lower on the week, technical about to get tighter in August
Municipals lagged Treasuries on the move lower in rates but ended the week lower and in line with Treasuries as rates stabilized. The summer is bringing no rest for muni bond investors as August looks to be the largest redemption and coupon inflow month this year with nearly ~$60bn coming back to investors. Expected supply is going to be short this number plus additional cashflows coming into the sector continue to stress the lopsided supply/demand technical that is already in place. In addition, Federal payments are hitting municipalities’ bank accounts meaning they will not need additional financing anytime soon, thus exacerbating the need for muni paper from investors.
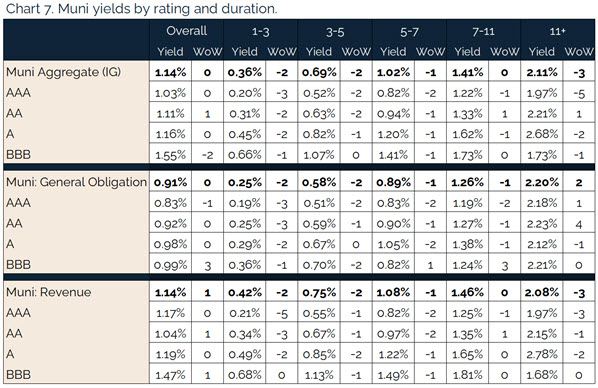
*Disclosure on all charts: Figures shown above are the weighted aggregate of bonds that currently have an IDC price and based off transactions over the past 2 weeks. This may create anomalies in the data but aligns with our effort to reflect actual market conditions. Data pulled as of end of day Thursday, July 22, 2021.
Fixed Income Trivia Time:
6
Want to get this in your email every Sunday? Sign up to receive The Fixed Income Brief weekly.
This paper is intended for information and discussion purposes only. The information contained in this publication is derived from data obtained from sources believed by IMTC to be reliable and is given in good faith, but no guarantees are made by IMTC with regard to the accuracy, completeness, or suitability of the information presented. Nothing within this paper should be relied upon as investment advice, and nothing within shall confer rights or remedies upon, you or any of your employees, creditors, holders of securities or other equity holders or any other person. Any opinions expressed reflect the current judgment of the authors of this paper and do not necessarily represent the opinion of IMTC. IMTC expressly disclaims all representations and warranties, express, implied, statutory or otherwise, whatsoever, including, but not limited to: (i) warranties of merchantability, fitness for a particular purpose, suitability, usage, title, or noninfringement; (ii) that the contents of this white paper are free from error; and (iii) that such contents will not infringe third-party rights. The information contained within this paper is the intellectual property of IMTC and any further dissemination of this paper should attribute rights to IMTC and include this disclaimer.
Related articles

January 6, 2025