The Fixed Income Brief: Every Breath You Take
The Fed meeting dominates fixed income investors’ attention this week as they feel the pressure of figuring out how rates will behave in the 2H of 2021.

June 20, 2021
Fixed Income Trivia Time:
The U.S. Bond “Flash Crash” occured on October 15, 2014. At its daily low, how many basis points did the 10-year U.S. Treasury fall that day?
The song “Every Breath You Take” – whether you prefer the classic Sting-led Police version from the 80s or the P. Diddy remix tribute to Notorious B.I.G. in the 90s – can be every fixed income investor’s theme song this week following Chairman Powell and the Fed.
Every breath you take
Every move you make
Every bond you break
Every step you take
I’ll be watching you
Every single day
Every word you say
Every game you play…
The end of “peak dovishness” was the best description one could make from Powell’s remarks, which raised the expected forecast of inflation in 2021 a full percent higher than March’s figure to 3.4% and from 2.00% to 2.10% for 2022. They also brought forward the expected first date of the next hike from 2024 to 2023 now, with two hikes expected according to the FOMC members’ dot plots. As anticipated, there was no indication on ending the Fed bond’s buying program, but they opened up the discussion around the possibilities of a future tapering. Fed Chairman Jerome Powell said, “you can think of this meeting that we had as the ‘talking about talking about’ meeting.” This language was reminiscent of Powell’s past remarks where he said the Fed was not “thinking about thinking about raising rates.” As Powell plays the Fed-speak game, it raises the risk of market participants misinterpreting the Fed in the coming months as Powell tries to thread a needle on the balance between slowly removing stimulus vs. the economic data coming in higher than anticipated (mainly inflation). As uncertain as fixed income investors are at this moment on the direction of rates and the future shape of the yield curve, one certainty is more volatility ahead given the range of views now on both sides of the debate.
The main economic event this week was certainly the Fed and their forecasts, but beyond that we saw price data coming higher than expected for May’s MoM Core PPI (+0.7% vs. +0.5 exp.) and MoM U.S. import and export prices, +1.1% vs. +0.8% exp. and +2.2% vs. 0.8% exp., respectively. U.S. industrial and manufacturing production data also came in stronger than anticipated, +0.8% vs. 0.6% exp. and +0.9% vs. 0.6% exp., respectively. Weekly initial jobless claims were +37k to 412k last week marking the first increase in several weeks. Despite the uptick, the 4-week average is now below 400k since the pandemic started last March, however, at 395k it is still +175k more than the pre-pandemic averages from early 2020. The key releases for next week are existing and new home sales, durable good orders, and the Fed’s favorite inflation measure, core PCE to be released on Friday. Fed Chairman Powell will also be testifying in front of Congress on Tuesday on “The Federal Reserve’s Response to the Coronavirus Pandemic” before the Select Subcommittee on Coronavirus Crisis.
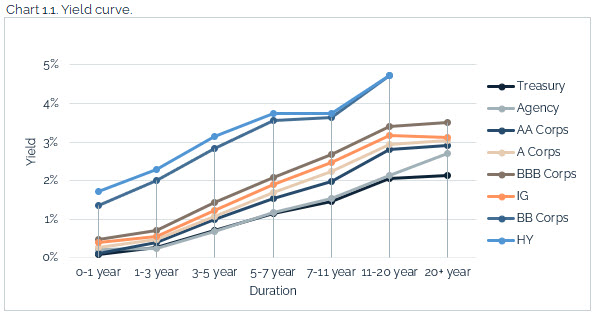
U.S. Treasury curve bear flattens as investors react to Fed outlook
After peaking at around +160bps at the end of Q1, the 2s-10s curve has flattened more than -35bps. The 2yr note finally joined in the fun, contributing to the recent change with yields higher +10bps WoW combined with the 10yr note relatively unchanged at 1.47%. The 5yr note was the worst spot on the curve, +15bps higher at 0.90%, and the 30yr bond was the outperformer, -12bps WoW ending the week at 2.03%.

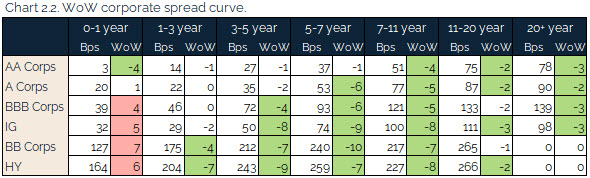
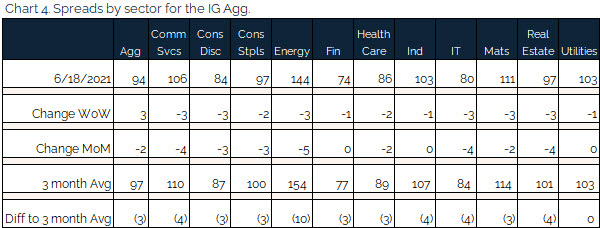
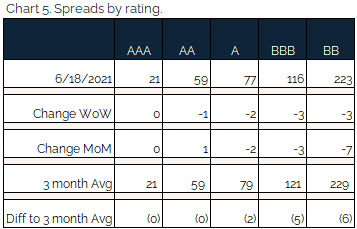
Credit spreads continue to hold in, HY and IG cash bond spreads through levels not seen since 2007
Reuters reported that the ICE BofA U.S. High Yield Index spread dipped to +312bps points mid-week, the lowest level since July 2007. That was -5bps lower than the prior day’s close as the market reacted to the Fed. High yield has not been the only beneficiary lately as investors around the globe continue the hunt for yield; the ICE BofA U.S. Investment Grade Index also performed well, reaching its lowest level since February 2007 this week.
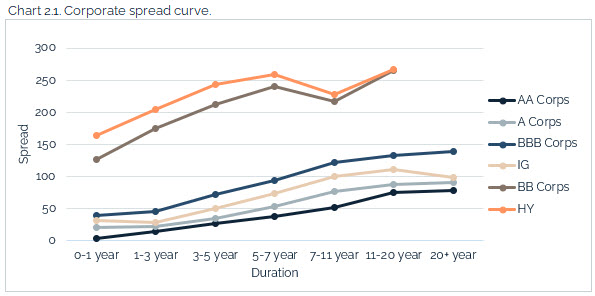
IG sector outperformance was relatively even across various segments except for safe-haven utilities and financials. Both have lagged on the month as investors have more appetite for risk and are less bullish on financials given the recent flattening of the Treasury curve.
No notable rating changes this week
There was a lack of any rating changes from S&P this week.
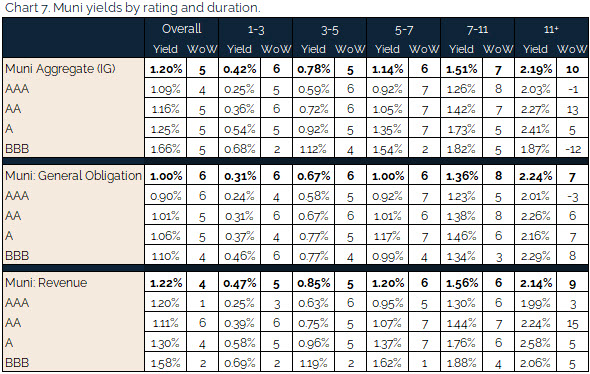
Muni yields higher across the curve, outperformed the intermediate part and lagged in the long end
Municipal investors saw higher bond yields across the curve with the U.S. Treasury curve higher out to 7 years and lower in longer-dated maturities – munis could not keep pace with the volatile rates markets this week. Given positive supply/demand technical, talk of a much-anticipated infrastructure bill, and a solid fundamental picture for state finances, it will be hard to see munis underperform Treasuries over the next 6-9 months. An estimated $49bn has been invested in the municipal bond market this year, according to Refinitiv Lipper. Given the increased search for yield, investors have been targeting high-yield muni bonds, which account for only 5% of the market but 25% of inflows.
*Disclosure on all charts: Figures shown above are the weighted aggregate of bonds that currently have an IDC price and based off transactions over the past 2 weeks. This may create anomalies in the data but aligns with our effort to reflect actual market conditions. Data pulled as of end of day Thursday, June 17, 2021.
Fixed Income Trivia Time:
33bps: The 10-year UST fell from 2.19% to 1.86%
Want to get this in your email every Sunday? Sign up to receive The Fixed Income Brief weekly.
This paper is intended for information and discussion purposes only. The information contained in this publication is derived from data obtained from sources believed by IMTC to be reliable and is given in good faith, but no guarantees are made by IMTC with regard to the accuracy, completeness, or suitability of the information presented. Nothing within this paper should be relied upon as investment advice, and nothing within shall confer rights or remedies upon, you or any of your employees, creditors, holders of securities or other equity holders or any other person. Any opinions expressed reflect the current judgment of the authors of this paper and do not necessarily represent the opinion of IMTC. IMTC expressly disclaims all representations and warranties, express, implied, statutory or otherwise, whatsoever, including, but not limited to: (i) warranties of merchantability, fitness for a particular purpose, suitability, usage, title, or noninfringement; (ii) that the contents of this white paper are free from error; and (iii) that such contents will not infringe third-party rights. The information contained within this paper is the intellectual property of IMTC and any further dissemination of this paper should attribute rights to IMTC and include this disclaimer.
Related articles

January 6, 2025