The Fixed Income Brief: Yield Curve Flashing in the Danger Zone
Rates markets continue their dismal run as March’s non-farm payroll did little to dissuade investor expectations of a +50bps hike at the next FOMC meeting; the yield curve rolls over with 2-10s officially inverted, posing the question of whether a recession is ahead.

April 3, 2022
Fixed Income Trivia Time:
Every recession has been preceded by a yield curve inversion for the past how many years? What year did this trend start?
—————–
Jobs, jobs, jobs. The current unemployment picture gives Chairman Powell and the FOMC a lot of slack to apply the brakes on a recovering economy where lingering inflationary impacts from the pandemic still seem far from resolving themselves. Bond investors are now pricing in an 81% probability of a +50bps hike in May, which should be confirmed by a few more elevated inflation prints coming up in April.
To put into perspective the rate moves investors have experienced over the last quarter, Deutsche Banks’ Chief Strategist Jim Reid puts it best: “Q1 2022 is set to be the worst quarter for DB’s 10yr UST series since the early 1980s. Since the US Civil War, 10yr U.S. Treasuries (or equivalents) have only seen a worse total return quarter in the early 1980s and in Q4 1931 after we passed the peak of the Depression-based rally.”
Employers added +431k jobs in March, which was less than expected (+490k), but revisions from the prior two months totaled +95k higher than previously reported and sent the unemployment rate to 3.6% (vs. 3.7% exp.). The unemployment rate in February 2020 was 3.5%, a 50yr low. The report marked the 11th straight month of job gains above +400k, which is the longest stretch of increase on record dating back to when they began recording in 1939. The latest reading of Core PCE Price Index, the Fed’s core measure of inflation, came in as expected (+.4% MoM and +5.4% YoY), but remains elevated and should push the Fed to stay aggressive here. The labor-force participation rate increased to 62.4% in March, up from 62.3% in February and from a trough of 60.2% in April 2020; this should lower some of the pressure on wages over the medium term as COVID fears subside and folks become more willing to work.
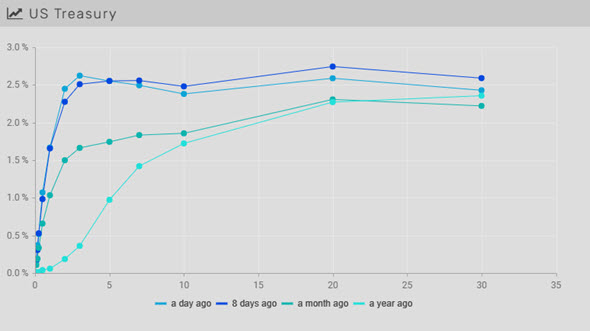
Rates push higher on non-farm payroll, 2-10s curve inverts
On Friday after the jobs report was released, 5 years and in ended up higher and the long end ended lower, after rates fell midweek on risk aversion and after solid increases the prior few weeks. The 2-10s curve is officially inverted (-4bps) as of midday Friday. The 2yr note rose +19bps WoW and the 10yr was down -3bps causing the inversion. The moves on the front end were exasperated by the most recent 2yr and 5yr auctions (2.365% and 2.543% respectively). At the time of writing, the 2yr, 5yr, 10yr, and 30yr are 2.46% (+19bps WoW), 2.58% (+5bps), 2.42% (-3bps), and 2.49% (-11bps) respectively.
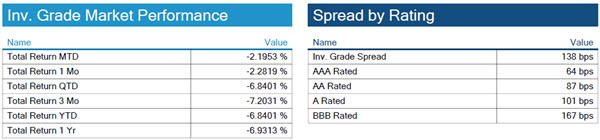
For the first time in over a month, spreads tighten WoW
Spreads tighten 5-4bps WoW as investors stomach the potential of an inverted yield curve in the long term. Beyond the yield curve, there are limited factors that point to a recession in the upcoming year. Investors will need to keep an eye on consumer confidence and additional economic data like home prices, as mortgage lending has significantly increased consumer debt.
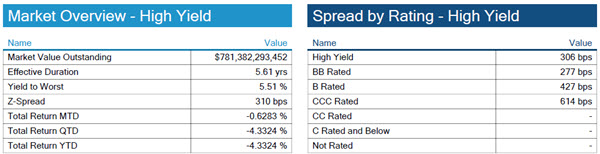
High yield spreads tighten for a second straight week
HY spreads tightened -30bps this week but are still wider on the year. The large idiosyncratic driver this week is Talen Energy, which announced that it will seek financing for a potential bankruptcy on the back of rising hedging costs.

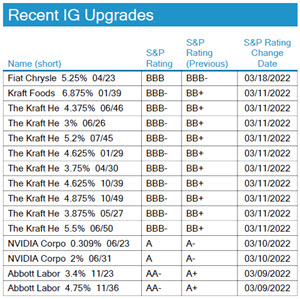
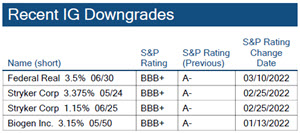
No S&P credit changes on week
No major changes to investment grade credit ratings.
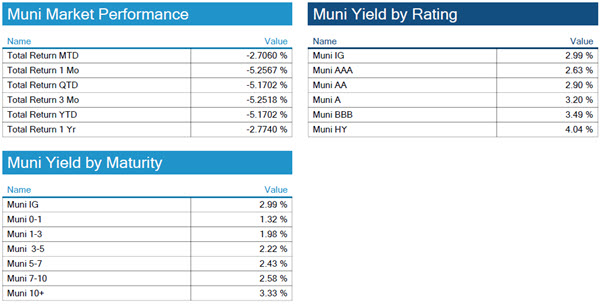
Municipal bond sector looks ahead to more demand on the back of higher yields and taxes
Like all fixed income sectors, municipal bonds have had a rough start to the year. On the positive side, the level of yields investors can now earn, Federal tax hike announcements, and potential lack of supply does set munis up to recover the fastest on any stabilization of underlying rates here. The White House’s $5.8T budget proposal adds 20% minimum on unrealized capital gains for households worth +$100mn. The Biden administration is also looking to raise the corporate tax rate to 28% from 21% and increase tax rates on the highest earners in the US to 39.6%. This could bring big demand from buyers on the institutional side and positive fund flows as munis offer both the tax advantage, but also a diversifier from typical spread product. Stay tuned.
*Disclosure on all charts: Figures shown above are the weighted aggregate of bonds that currently have an IDC price and based on transactions over the past 2 weeks. This may create anomalies in the data but aligns with our effort to reflect actual market conditions. Data pulled as of end of day Thursday, March 31, 2022.
View full IG, HY, and muni market reports pulled from IMTC:
Fixed Income Trivia Time:
66 years since 1956
Want to get this in your email every Sunday? Sign up to receive The Fixed Income Brief weekly.
This paper is intended for information and discussion purposes only. The information contained in this publication is derived from data obtained from sources believed by IMTC to be reliable and is given in good faith, but no guarantees are made by IMTC with regard to the accuracy, completeness, or suitability of the information presented. Nothing within this paper should be relied upon as investment advice, and nothing within shall confer rights or remedies upon, you or any of your employees, creditors, holders of securities or other equity holders or any other person. Any opinions expressed reflect the current judgment of the authors of this paper and do not necessarily represent the opinion of IMTC. IMTC expressly disclaims all representations and warranties, express, implied, statutory or otherwise, whatsoever, including, but not limited to: (i) warranties of merchantability, fitness for a particular purpose, suitability, usage, title, or noninfringement; (ii) that the contents of this white paper are free from error; and (iii) that such contents will not infringe third-party rights. The information contained within this paper is the intellectual property of IMTC and any further dissemination of this paper should attribute rights to IMTC and include this disclaimer.
.
.
Related articles

January 6, 2025