The Fixed Income Brief: Gesundheit – It’s a Global Affair

Fixed Income Trivia Time:
When was the last time the 10-year bund was positive?
—————–
As fixed income investors turn the page on a dismal January, the start of February offered no respite. Bonds have posted negative total returns across all sectors and continents as rates and credit spreads have risen on the shift in sentiment around the pace of the Fed and other central banks’ monetary stimulus unwind. This past week was the BoE and ECB’s chance to address the recent uptick in inflation, and both took different paths on how to move forward. The Bank of England, which was the first to raise rates in December, continued to move forward with rate hikes, whereas the ECB held firm that QE and rate hikes are off the table until October 2022.
Prior to their meeting they had not alluded to any changes in their support until 2023 as economic activity (services) and unemployment still have room to improve. Europe tends to recover unevenly, so the ECB wants to be sure some of the weaker countries aren’t faced with higher rates as they attempt to fully recover. Despite their stance, investors have sent Bund yields ~+25bps WoW, now well into positive territory along with higher sovereign rates higher across the region, with some investors betting the ECB will need to act well before October to stem inflationary expectations from moving too high.
Friday’s jobs number, despite short expectations (+467 vs. +510k), showed plenty of strength. Prior month revisions of a combined +709k jobs in November and December shows the U.S. economy had more momentum than originally thought going into the end of the year. In addition, average hourly earnings ticked higher than expected, up +0.7 vs. +0.5% and +5.7% vs. 5.0% on a MoM and YoY basis respectively. Despite the small uptick in the unemployment rate to 4.0% from 3.9%, this was due to an increase in the Participation Rate which means more folks ready to reenter the labor market. Lastly, the U6 Unemployment improved from 7.3% to 7.1%. All of this makes the Fed look very justified here as the economy shrugged off the latest Covid variant and is pushing ahead at full steam.
Calm until jobs number release
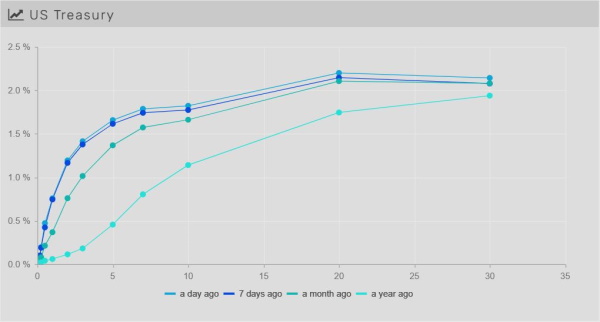
Rates for most of the week were significantly less volatile than the prior weeks leading up to the FOMC meeting, but that ended quickly as the details behind the non-farm payrolls number re-confirmed the Fed will remain on track to significantly unwind stimulus starting in March.
Talk of an initial +50bps move is now in the cards, with a 40% chance being priced in along with 5.5 total hikes for 2022. Most of the curve moved in parallel fashion, rising between 14-17bps out to the 10yr, with the 30yr ~+12bps higher WoW. The 5yr note is closing the week out at 1.77%, roughly +20bps off its mid-week lows.
Credit spreads flirt with 12-month wides
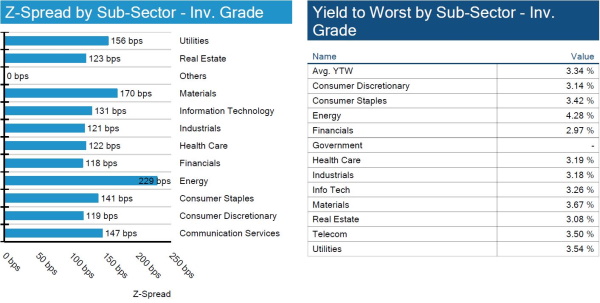
Spreads widened ~5bps on the week to come within a couple basis points of the 12-month high. Not surprisingly, the largest spread swings came from BBB while AA spreads ended flat on positive earnings from some large AA issuers. Investment grade total return is -30bps in February and -3.7% for all of 2022.

High yield spreads move wider
HY spreads widen, but it does not slow down new issuance, which has remained strong (up ~13% YoY) in the high yield space. Default rates continue to fall month over month which keeps spreads in check. Next week investors will look at January CPI to see how all-in yields are affected.


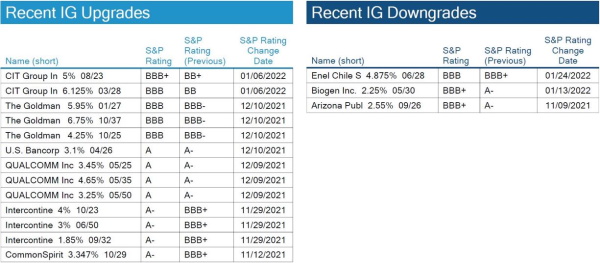
No IG rating changes this week
S&P didn’t have any noteworthy rating changes for IG issuers.
Munis look more attractive after sell-off
Despite the negative returns, the large majority of municipal bond investors are more likely to buy any continued sell-off given the amount of money that still needs to be put to work. The pace of their investments is likely to slow to see the impact of the recalibration of the number of hikes expected in 2022, but the expectations are that the net amount will be the same. This leaves the technical picture still intact despite less expected relief from Washington. Total returns have started well for munis in February, but the data provided does not take in to account rate moves post the non-farm payroll data.
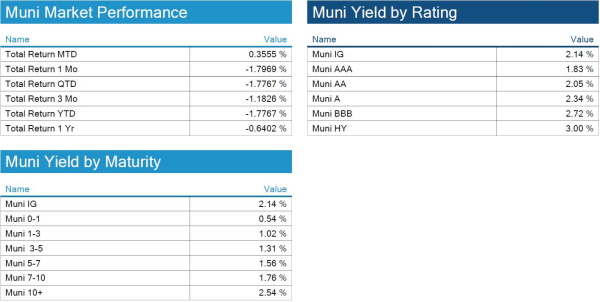
*Disclosure on all charts: Figures shown above are the weighted aggregate of bonds that currently have an IDC price and based on transactions over the past 2 weeks. This may create anomalies in the data but aligns with our effort to reflect actual market conditions. Data pulled as of end of day Thursday, February 3, 2022.
View full IG, HY, and muni market reports pulled from IMTC:
Fixed Income Trivia Time:
May 2019
Want to get this in your email every Sunday? Sign up to receive The Fixed Income Brief weekly.
.


